Export Django monitoring metrics for Prometheus.io

-
This is a fork https://github.com/korfuri/django-prometheus with fixes and improvements.
-
The final goal of this fork is do fixes and make the project ready to be maintained by jazzband.
-
Avoiding forking is always preferable so if the original maintainer can get involved in this process we would be very happy.
-
This fork attempts to not break API's which exists in release versions unless the API's themselves are broken.
-
This fork currently does not officially support python 2, if the original maintainer gets involved and strongly disagree with this decision py2 support can be reinstated (No active removal has been done except for the Travis). Currently, very old django versions are also removed from the travis test matrix but if they are very important for some reason they can be reinstated.
-
Depending on future maintainer circumstances this repository might be fully removed or moved and the -py-pa suffixed packages released to pypi.org will stop being published and in removed 6 months after the last published version.
- Django >= 1.8
- Python 3
Install with:
pip install django-prometheusOr, if you're using a development version cloned from this repository:
python path-to-where-you-cloned-django-prometheus/setup.py installThis will install prometheus_client as a dependency.
In your settings.py:
INSTALLED_APPS = (
   ...
   'django_prometheus',
   ...
)

MIDDLEWARE_CLASSES = (
    'django_prometheus.middleware.PrometheusBeforeMiddleware',
    # All your other middlewares go here, including the default
    # middlewares like SessionMiddleware, CommonMiddleware,
    # CsrfViewmiddleware, SecurityMiddleware, etc.
    'django_prometheus.middleware.PrometheusAfterMiddleware',
)
In your urls.py:
urlpatterns = [
    ...
    url('', include('django_prometheus.urls')),
]Currently, only SQLite and MySQL databases can be monitored. Just
replace the ENGINE property of your database, replacing
django.db.backends with django_prometheus.db.backends.
DATABASES = {
    'default': {
        'ENGINE': 'django_prometheus.db.backends.sqlite3',
        'NAME': os.path.join(BASE_DIR, 'db.sqlite3'),
    },
}You may want to monitor the creation/deletion/update rate for your model. This can be done by adding a mixin to them. This is safe to do on existing models (it does not require a migration).
If your model is:
class Dog(models.Model):
    name = models.CharField(max_length=100, unique=True)
    breed = models.CharField(max_length=100, blank=True, null=True)
    age = models.PositiveIntegerField(blank=True, null=True)
Just add the ExportModelOperationsMixin as such:
from django_prometheus.models import ExportModelOperationsMixin

class Dog(ExportModelOperationsMixin('dog'), models.Model):
    name = models.CharField(max_length=100, unique=True)
    breed = models.CharField(max_length=100, blank=True, null=True)
    age = models.PositiveIntegerField(blank=True, null=True)
This will export 3 metrics, django_model_inserts_total{model="dog"},
django_model_updates_total{model="dog"} and
django_model_deletes_total{model="dog"}.
Note that the exported metrics are counters of creations, modifications and deletions done in the current process. They are not gauges of the number of objects in the model.
Starting with Django 1.7, migrations are also monitored. Two gauges
are exported, django_migrations_applied_by_connection and
django_migrations_unapplied_by_connection. You may want to alert if
there are unapplied migrations.
Prometheus is quite easy to set up. An example prometheus.conf to
scrape 127.0.0.1:8000 can be found in examples/prometheus.
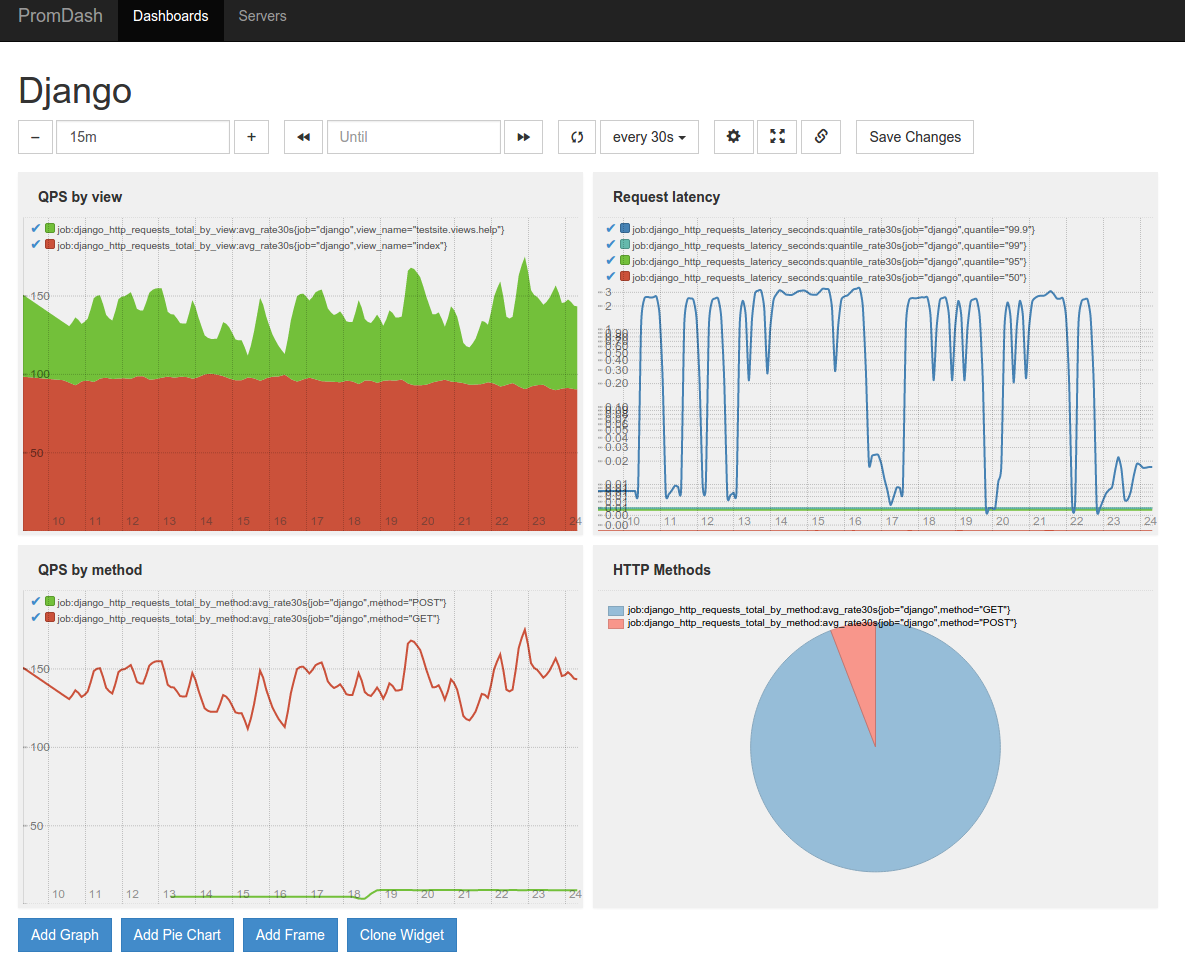
Here's an example of a PromDash displaying some of the metrics collected by django-prometheus:
You can add application-level metrics in your code by using prometheus_client directly. The exporter is global and will pick up your metrics.
To add metrics to the Django internals, the easiest way is to extend django-prometheus' classes. Please consider contributing your metrics, pull requests are welcome. Make sure to read the Prometheus best practices on instrumentation and naming.