MagellanMapper is a graphical imaging informatics suite and pipeline for high-throughput, automated analysis of whole specimen. Its design philosophy is to make the raw 3D images as accessible as possible, simplify annotation from nuclei to atlases, and scale from the laptop to the cloud in cross-platform environments.
- Download MagellanMapper
- Get the latest release and unzip/extract it
- Or clone this repo:
git clone https://github.com/sanderslab/magellanmapper.git
- Install MagellanMapper using this script in the
magellanmapperfolder, which also installs Conda if not found- On Mac or Linux:
bin/setup_conda - On Windows:
bin\setup_conda.bat
- On Mac or Linux:
- On Mac, it may be necessary to right-click and "Open with" the Terminal app
- On Files in Linux, it may be necessary to go to "Preferences," select the "Behavior" tab, and choose to "Run" or "Ask" when executing text files
- See Installation for more details, including installation without Conda, using Pip or Venv+Pip instead
On Mac or Linux: Run the MagellanMapper file created during Conda setup.
- See Install Notes above running this file from a file browser
On Windows: Run run.py through Python.
- It may be necessary to right-click, choose "Open with", and browse to the Conda
pythonw.exefile to openrun.py - If a security warning displays, click on "More info" and "Run anyway" to launch the file
Note that during the first run, there may be a delay of up to several minutes from antivirus scanning for the new Python interpreter location in the new environment. Subsequent launches are typically much faster.
conda activate mag
python <path-to-magellanmapper>/run.py
This approach is recommended when running command-line tasks or for debugging output. Replace mag if you gave the environment a different name.
MagellanMapper can be run as a GUI as described above or headlessly for automated tasks. sample_cmds.sh is a script that shows examples of common commands. You can also use pipelines.sh, a script to run many automated pipelines within MagellanMapper, such as whole volume nuclei detection and image transposition. See below for more details. See Settings for how to customize settings to your image files.
Medical imaging formats such as .mha (or .mhd/.raw) and .nii (or .nii.gz) are opened with SimpleITK/SimpleElastix and do not require separate import. For standard image formats such as TIFF or proprietary microscopy formats such as CZI, MagellanMapper imports these files into a standard Numpy format, which allows on-the-fly loading to reduce memory requirements and initial loading time.
In the "Import" tab, you can select files, view and update metadata, and import them into a Numpy array.
To try out functions with sample images, download any of these files:
- Sample region of nuclei at 4x (
sample_region.zip) - Sample downsampled tissue cleared whole brain (
sample_brain.zip) - Allen Developing Mouse Brain Atlas E18.5 (
ADMBA-E18pt5)
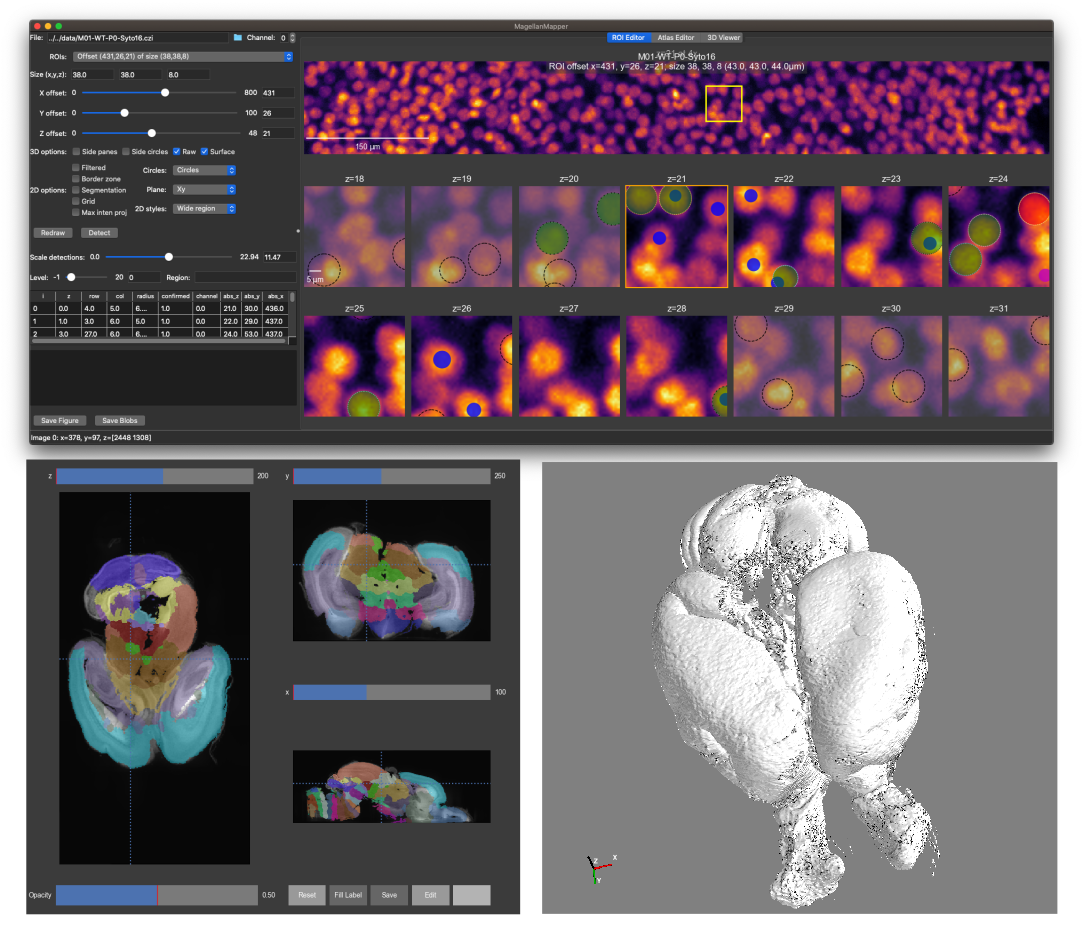
The main MagellanMapper GUI displays a 3D viewer and region of interest (ROI) selection controls. MagellanMapper uses Mayavi for 3D voxel or surface rendering.
From the ROI selection controls, two different 2D editors can be opened. All but the last 2D styles option open various forms of the Nuclei Annotation Editor. The final option opens the Atlas Editor, a 2D/3D viewer.
The multi-level 2D plotter is geared toward simplifying annotation for nuclei. Select the ROI Editor tab to view the editor. Press the Redraw button to redraw the editor at the selected ROI. To detect and display nuclei in the ROI, select the Detect tab and press the Detect button.
- Click on dotted lines to cycle the nuclei detection flags from incorrect (red), correct (green), or questionable (yellow)
Shift+clickand drag to move the circle's positionAlt+clickand drag to resize the circle's radius"c"+clickto copy the circle"v"+clickin another z-plane to duplicate that circle in the corresponding position in that plane"x"+clickto cut the circle"d"+clickto delete the circle- Arrow
up/rightto increase anddown/leftto decrease the overview plots' z-plane Right-clickon an ROI plane to jump to the corresponding z-plane in the overview plotsLeft-clickin an overview plot to preview the ROI at that position- Double
right-clickin an overview plot to redraw the editor at that ROI
The multi-planar image plotter allows simplified viewing and editing of annotation labels for an atlas. Existing labels can be painted into adjacent areas, and synchronized planar viewing allows visualization of changes in each plane with realtime updates.
To view the editor, select the Atlas Editor tab. The Redraw button in the ROI tab of the left panel will redraw the editor if necessary. The Registered images section allows selecting any available annotations and label reference files to overlay.
- Mouseover over any label to see the region name
Left-clickto move the crosshairs and the corresponding planes- Scroll or arrow
up/downto move planes in the current plot Right-clickorCtrl+left-clickwhile moving the mouse up/down to zoomMiddle-clickorShift+left-clickwhile dragging the mouse to panato toggle between 0 and full labels alpha (opacity)shift+ato halve alpha (pressatwice to return to original alpha)
Press on the "Edit" button to start painting labels using these controls:
Left-clickto pick a color, then drag to paint over a new areaAlt+Left-clickto use the last picked color instead[/](brackets) to make the paintbrush smaller/bigger; addshiftto halve the increment- Use the save button in the main window with the atlas window still open to resave
Automated processing will attempt to scale based on your system resources but may require some manual intervention. This pipeline has been tested on a Macbook Pro laptop and AWS EC2 Linux (RHEL and Amazon Linux based) instances.
Optional dependencies:
- ImageJ/Fiji with the BigStitcher plugin: required for tile stitching; downloaded automatically onto a server when running
deploy.sh - ImageMagick: required for exporting a stack of planes to an animated GIF file
- FFMpeg: required to export a stack to a movie format such as MP4
- Slack incoming webhook: to notify when tile stitching alignment is ready for verification and pipeline has completed
Run a pipeline in pipelines.sh.
For example, load a .czi file and display in the GUI, which will import the file into a Numpy format for faster future loading:
bin/pipelines.sh -i data/HugeImage.czi
To sitch a multi-tile image and perform cell detection on the entire image, which will load BigStitcher in ImageJ/Fiji for tile stitching:
bin/pipelines.sh -i data/HugeImage.czi -p full
See bin/pipelines.sh for additional sample commands for common scenarios, such as cell detection on a small region of interest. The file can be edited directly to load the same image, for example.
You can launch a standard server, deploy MagellanMapper code, and run a pipeline. See tools for AWS cloud management for more details.
Licensed under the open-source BSD-3 license
Author: David Young, 2017, 2020, Stephan Sanders Lab