
Provides a new artist for matplotlib to display a colorbar, instead of an axis as it is the default in matplotlib. The position of the colorbar artist can be decided as for the legend.
The artist supports customization either directly from the ColorBar object or from the matplotlibrc.
Easiest way to install using pip:
$ pip install matplotlib-colorbarFor development installation from the git repository:
$ git clone git@github.com:ppinard/matplotlib-colorbar.git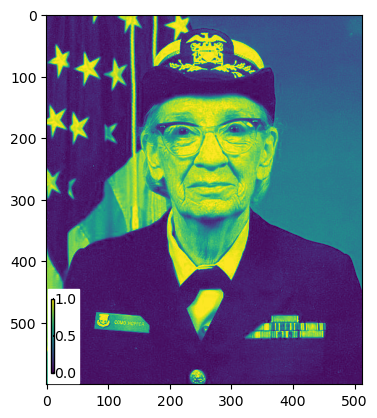
$ pip install -e matplotlib-colorbarHere is an example how to add a scale bar:
>>> import numpy as np
>>> import matplotlib.pyplot as plt
>>> import matplotlib.cbook as cbook
>>> from matplotlib_colorbar.colorbar import ColorBar
>>> plt.figure()
>>> data = np.array(plt.imread(cbook.get_sample_data('grace_hopper.png')))
>>> mappable = plt.imshow(data[...,0], cmap='viridis')
>>> colorbar = ColorBar(mappable, location='lower left')
>>> plt.gca().add_artist(colorbar)
>>> plt.show()Here are parameters that can either be customized in the constructor of the ColorBar class or in the matplotlibrc file.
mappable: scalar mappable object which implements the methods get_cmap and get_array (default:None, the mappable can be specified later)label: label on top of the color bar (default:None, no label is shown)orientation: orientation,verticalorhorizontal(default:vertical)nbins: number of color division in the color bar (default: or 50)length_fraction: length of the color bar as a fraction of the axes's width (horizontal) or height (vertical) depending on the orientation (default:0.2)width_fraction: width of the color bar as a fraction of the axes's height (horizontal) or width (vertical) depending on the orientation (default:0.02)location: a location code (same as legend) (default:upper right)pad: fraction of the font size (default:0.2)border_pad: fraction of the font size (default:0.1)sep: separation between color bar and label in points (default:5)frameon: if True, will draw a box around the color bar (default:True)color: color for the tick text and label (default:k)box_color: color of the box (if frameon) (default:w)box_alpha: transparency of box (default:1.0)font_properties: a matplotlib.font_manager.FontProperties instance, optional sets the font properties for the label textticks: ticks location (default: minimal and maximal values)ticklabels: a list of tick labels (same length asticksargument)
License under the BSD License, compatible with matplotlib.
Copyright (c) 2015 Philippe Pinard