These are scripts developed for GIS 8890, a directed studies course in the MGIS program at the University of Minnesota.
The goal of our project is to create a state-wide solar suitability map from lidar data.
We settled on using LASTools and ArcGIS (via ArcPy) for this project.
We started with roughly 1Tb of .laz files, available from the state of Minnesota's FTP site.
Our output is a raster mosaic of Solar Analyst results.
Your data will probably break in different ways than ours, but here's what worked for us.
We used a PostGIS database for storing and accessing metadata quickly. We used three tables.
- The Lidar BBox Table -- A table with the bounding box and name of all the lidar files
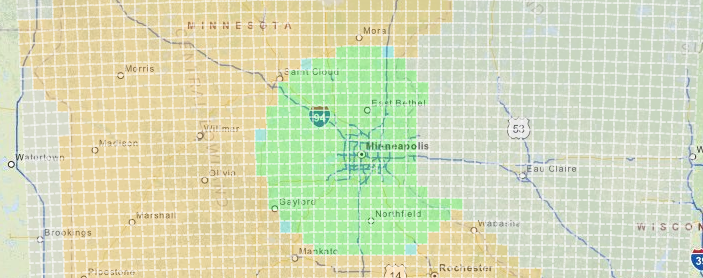
- The DEM Fishnet Table -- A table with a fishnet that covered our state for use in creating DEM raster files
- The Spatial Analyst Fishnet Table -- A table with a fishnet covering the state for use in creating the Solar Analyst raster files
We calculated the bounding box for each LiDAR .laz file and inserted it into the Lidar BBox table. We then used the DEM Fishnet Table as a sort of job queue. By running an intersect between the Lidar BBox table and one DEM fishnet square at a time we could use just the .laz files we needed to generate the output DEM file. By buffering the DEM fishnet and limiting the output area of the DEM we were able to ensure that our output raster images were all coincident.
When all DEM files were generated (about another Tb of data) we created a raster mosaic of them, and used that as input to Solar Analyst. Once again, using a fishnet as a job queue we ran Solar Analyst on the extent of each Spatial Analyst Fishnet square and saved the resulting image to a directory.
When all Solar Analyst tasks were complete, we added the images to a new raster mosaic which we could then use for data analysis or other purposes.
You can run configTest.py to see if your configuration is good. If it is, you can skip this section!
You will need:
- .las or .laz files
- LASTools
- ArcPy / Python
- The psycopg2 Python module
- The simplejson Python module
- A PostGIS database
If the version of Python that ships with ArcGIS is not in your default %PATH% you can either edit the system path, or run all of the scripts from within the Windows PowerShell which is linked here. If you are going to use PowerShell and ArcGIS's Python is not located at C:\Python27\ArcGIS10.2, you will need to edit POWERSHELL_SETTINGS.ps1 to set the correct path.
-
Copy and edit the configuration file
WARNING: WORK IN PROGRESS
Copy config.cfg.example to config.cfg and replace the existing values with the values for your PostGIS database connection.
-
Create a PostGIS database
Optionally create a schema for this project.
Run the createDatabaseTables.py script to create the appropriate tables and indexes.
-
lasIndex.py -- Create las index files (.lax) for all the laz files.
python.exe .\steps_sql\lasIndex.py D:\SolarResourceData\MinnesotaLiDAR_LAZ -
lasbbox2sql.py -- Create an .sql file to insert into PostGIS with buffered bounding boxes for all las. This script uses the laz header info and doesn't calculate the actual exact extent (hence the buffer)
python.exe .\steps_sql\lasbbox2sql.py D:\SolarResourceData\MinnesotaLiDAR_LAZ data\insert_lidar_bboxes.sqlInsert the resulting sql file into a PostGIS table with the following definition:
CREATE TABLE lidar_bbox ( id serial NOT NULL, lasfile character varying, the_geom geometry(Polygon,26915), CONSTRAINT lidar_bbox_pkey PRIMARY KEY (id), CONSTRAINT lidar_bbox_unique_file UNIQUE (lasfile) ) WITH ( OIDS=FALSE); CREATE INDEX bbox_gist ON lidar_bbox USING gist (the_geom); -
las2fishnetSql.py -- Create a fishnet across coordinates which will work with blast2dem, ideally with nice round numbers.
python.exe .\steps_sql\las2fishnetSql.py D:\SolarResourceData\MinnesotaLiDAR_LAZ 3 10000 data\dem_fishnet.sqlInsert the resulting sql file into a PostGIS table with the following definition:
CREATE TABLE dem_fishnets ( id serial NOT NULL, the_geom geometry(Polygon,26915), state integer DEFAULT 0, CONSTRAINT dem_fishnets_pkey PRIMARY KEY (id) ) WITH ( OIDS=FALSE); CREATE INDEX dem_gist ON dem_fishnets USING gist (the_geom); CREATE INDEX dem_state_index ON dem_fishnets USING btree (state); -
Let PostGIS figure rule out any fishnet tiles which don't cover any lidar bounding boxes. Run:
UPDATE dem_fishnets SET state=-1 WHERE id in ( SELECT dem.id FROM dem_fishnets dem, lidar_bbox bbox WHERE NOT ST_Intersects(ST_Buffer(dem.the_geom,100),bbox.the_geom) ) -
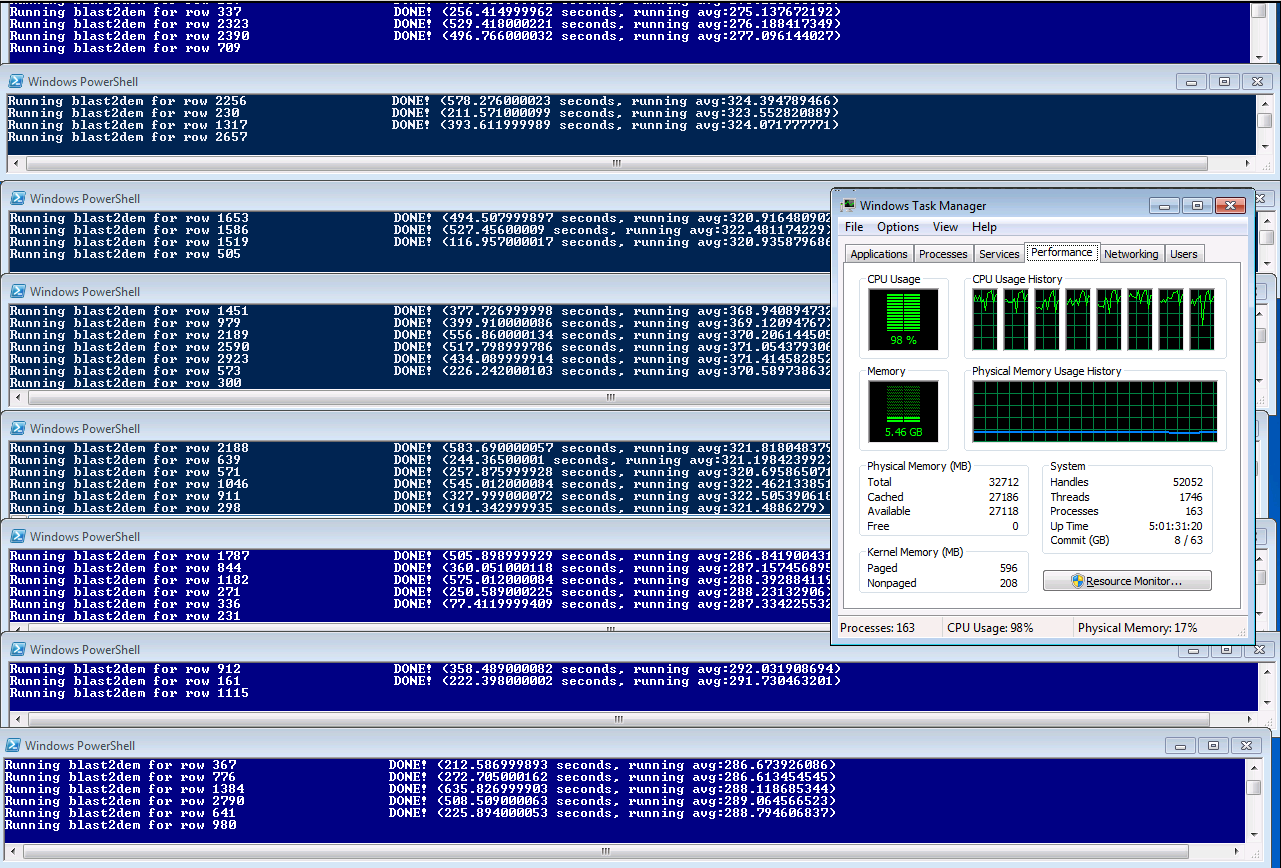
makeDems.py -- Run as many instances of makeDems.py as you can to create DEM files. blast2dem only uses one cores. Balance disk IO, memory and CPU usage to get the best average times you can.
python.exe .\steps_sql\makeDems.py D:\SolarResourceData\MinnesotaLiDAR_LAZ D:\SolarResourceData\MinnesotaLiDAR_DSM\fishnet_tiles -
dem2mosaic.py -- Convert DSMs to raster mosaic
Create directory D:\SolarResourceData\MinnesotaLiDAR_DSM\fishnet_mosaic
python.exe .\steps_sql\dems2mosaic.py D:\SolarResourceData\MinnesotaLiDAR_DSM\fishnet_tiles D:\SolarResourceData\MinnesotaLiDAR_DSM\fishnet_tiles D:\SolarResourceData\MinnesotaLiDAR_DSM\fishnet_mosaic data\MN_Fishnet\MN_Fishnet.prj -
QA Step ?
Should we have a QA step here to visually inspect the mosaic in Arc and see that the DSMs look good before we run Solar Analyst?
-
Create a fishnet across coordinates which will work with Solar Analyist, ideally with nice round numbers. Input the fishnet into PostGIS in a table like this:
CREATE TABLE sa_fishnets ( id serial NOT NULL, the_geom geometry(Polygon,26915), state integer DEFAULT 0, CONSTRAINT sa_fishnets_pkey PRIMARY KEY (id) ) WITH ( OIDS=FALSE); ALTER TABLE sa_fishnets OWNER TO solar; CREATE INDEX sa_fishnets_geom_gist ON sa_fishnets USING gist (the_geom); CREATE INDEX sa_fishnets_state ON sa_fishnets USING btree (state); -
batchSolarAnalyst.py -- Runs solar analyst on each sa_fishnet
tbd -
Mosaic solar raster tiles to single image?
tbd
A progress viewer website is available in this repository. You will need to configure your server to treat .py files as CGI executables. If you are using Apache and .htaccess overrides are enabled, the included web/.htaccess file will do this for you.
It uses Leaflet.js to display the progress.

