I used the visual processing data set for the final project. The data contained spike times of neural single units recorded in cortices of apes that were exposed to images which were flashed on a screen. The dataset was subdivided into spike times of images that caused a low response of neurons ([ineffective targets]) and spike times of images that a caused high response of neurons ([effective targets]). I filtered the data by sorting the spike times of single units according to their respective picture and used primarily the spike times which were recorded after the apes have been exposed to the image.
I calculated the average frequency of neurons within discrete time intervalls of 100 ms in order to find higher order patterns of neural response. I hypothesized that the collecive response of single units may establish a distinct frequency pattern that is specific for ineffective or effevtive targets, respectively. Therefore, I wrote a python script that visualizes the neural response of the single units in form of histograms and scatter plots.
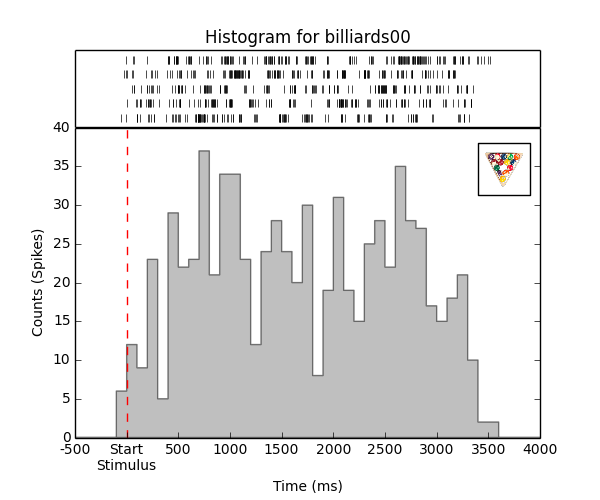
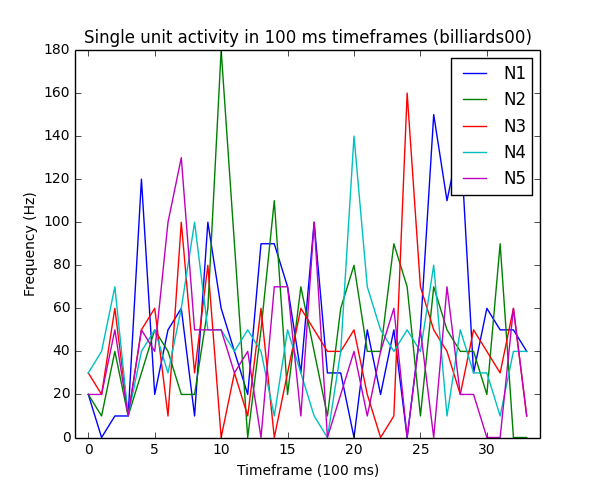
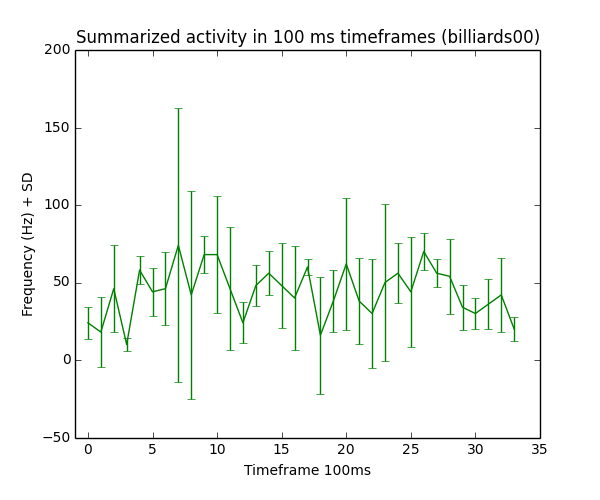
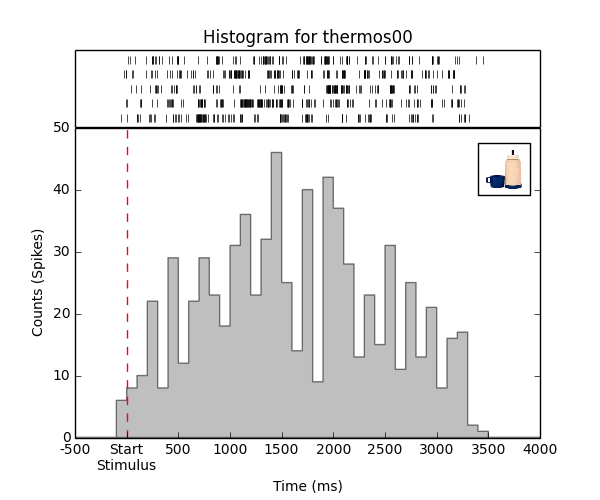
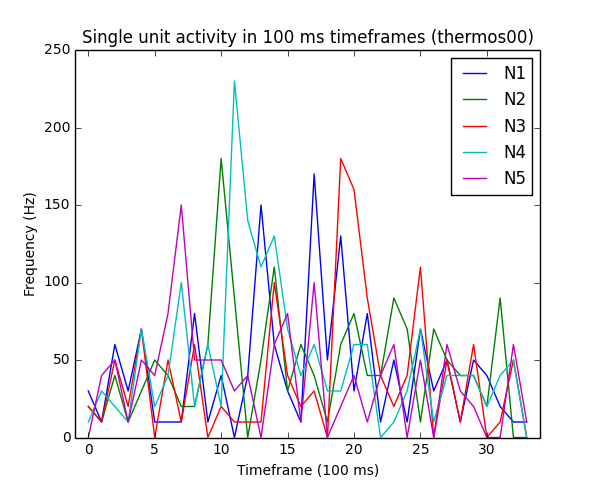
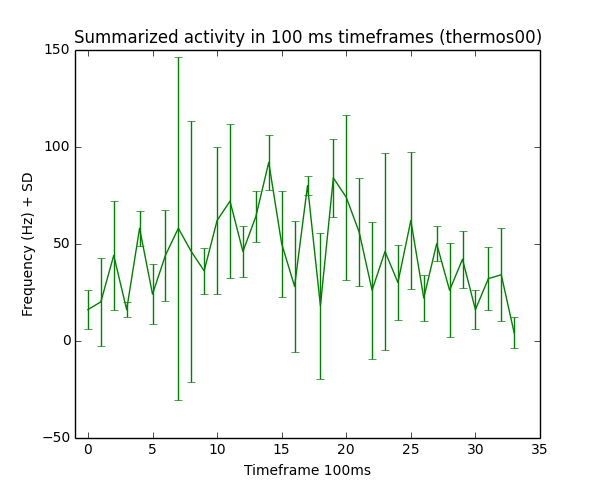
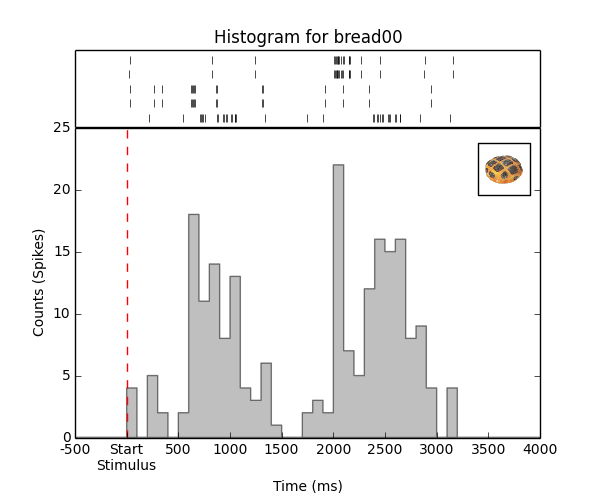
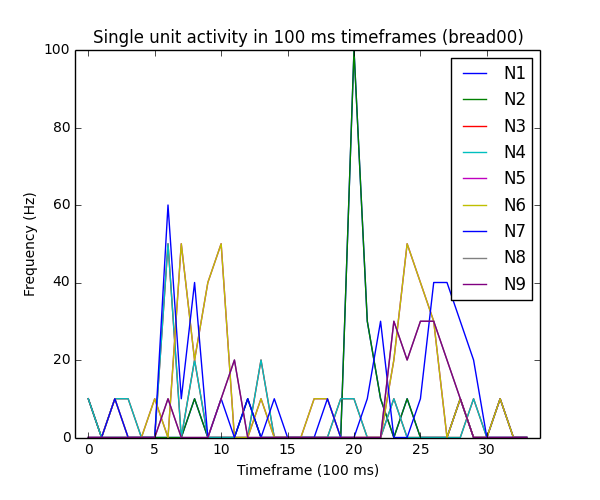
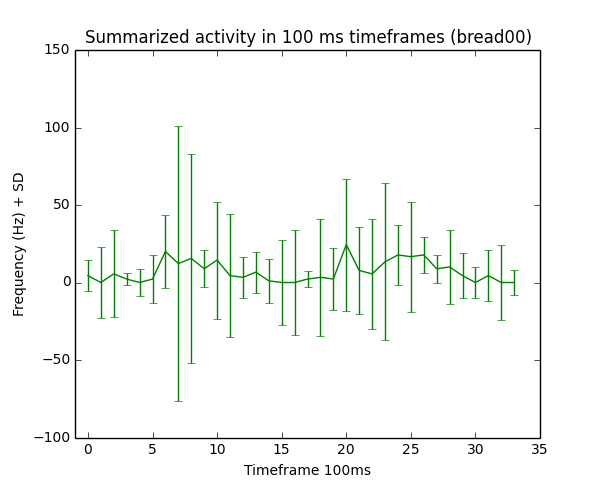
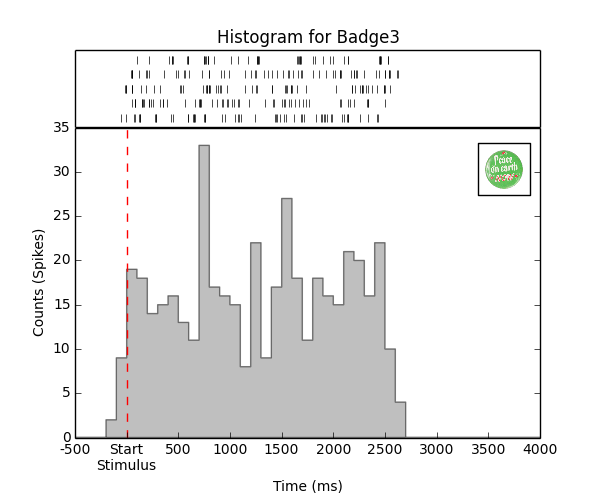
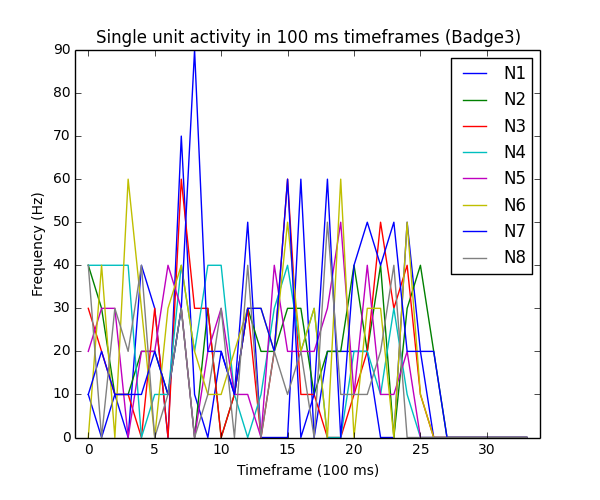
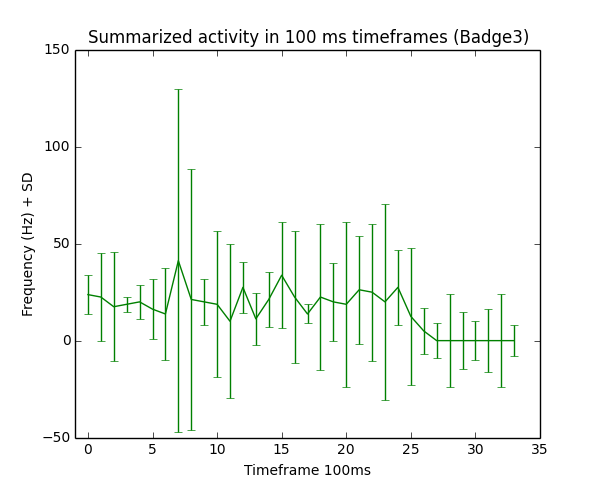
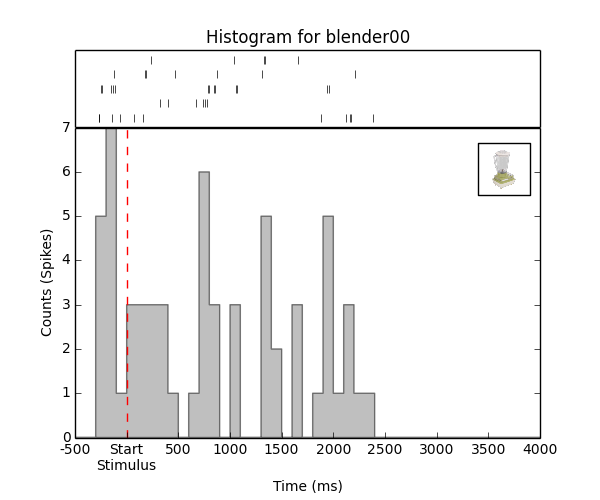
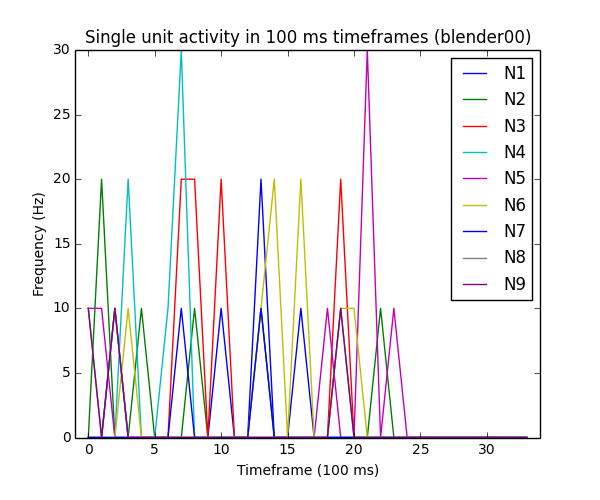
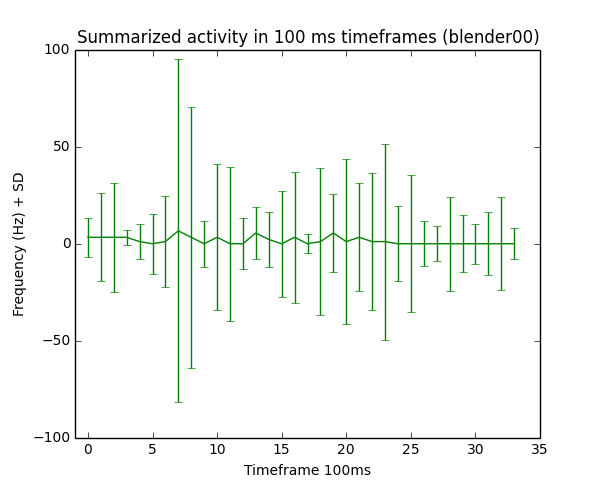
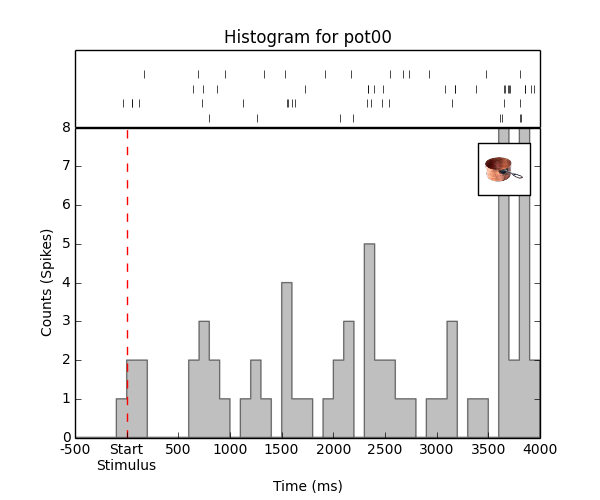
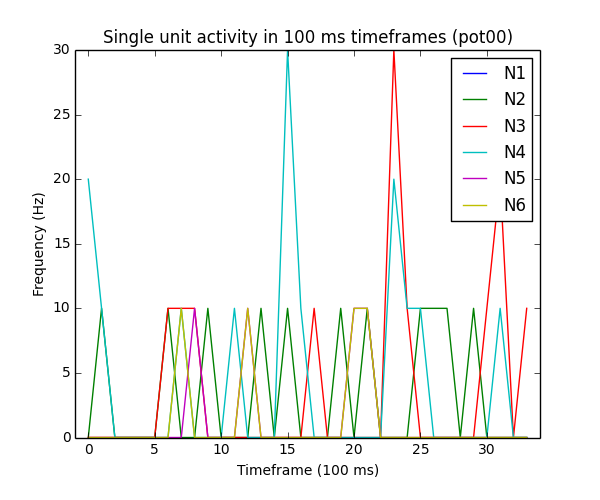
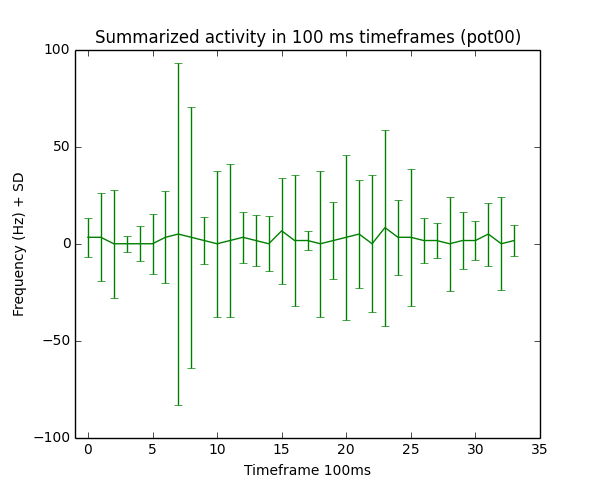
Representative plots (remaining figures can be viewied on github). The first row of plots show spikes in a raster plot (upper panel) and the spike times in a histogram (bin size 100 ms, lower panel). The stimulus (image) is depicted in the upper right corner of the histogram. The number of spikes of each single unit is plotted in the second row of images. Finally in the third row the the mean of the all measured spikes is ploted, the errorbars indicate the standard deviation.
The frequency pattern of the effective and ineffective targets differed. My data suggested that effective targets are able to cause firing rates up to 200 Hz in multiple neurons over a time span up to 3 s. In contrast, ineffective patterns result in lower firing rates in single neurons and the the timespan in which activity could be measured is lower. The summarized activity of all neurons recorded in the experiment is in ineffective targets more or less constant where as effective targets show oscillating behaviour.
I used many matrices to get the data processed. The functions which extract the data use extensively use np.size() and np.zero() to generate dummy matrices which can then be filled with filtered data.
The code up so far is inefficient and to some extend buggy. Due to time limitation, unfortunately, I was not able to properly comment the code which makes the code hard to read. Another problem concerning the analysis is that the time intervalls were selected randomly. The code so far is built to manage other timeframes, however, I was not able to debug the code to assure that functionality.
The code contains parts of a potential follow-up analysis. I want to cluster the images by means of simple eucledian distance to assess the question whether effective or ineffective targets are similar. Furthermore, I want to check if a higher time resolution (time frames < 100ms) lead to more characteristic higher order patterns.