Drawing diagrams for a software system is a boring chore, and it is hard to make everything aligned and symmetrical. This is my attempt to make diagram drawing a programmer-friendly experience. Just specify your diagram in a JSON file, and run:
python diajson.py your_diagram.json out.svg
The diagram is rendered in a .svg file, you can convert that to any image format you like.
The JSON file format includes several node types: box/cluster/layer/container/repeat, and edges between the nodes. The format is quite self-explanatory. To draw a diagram like this:
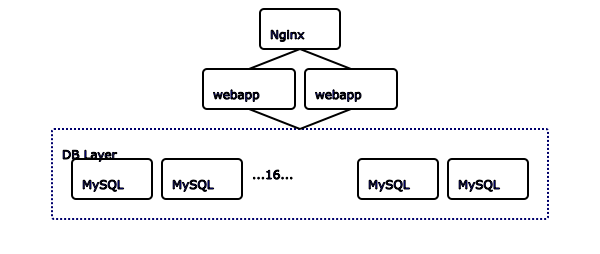
Describe your diagram like this:
{
"node": {
	"type": "layer",
	"id": "root",
	"children":[
		{
			"type":"box",
			"id": "nginx",
			"label": "Nginx"
		},
		{
			"type":"cluster",
			"id": "webapp",
			"children": [
				{
					"type": "box",
					"id": "webapp1",
					"label": "webapp"
				},
				{
					"type": "box",
					"id": "webapp2",
					"label": "webapp"
				}
			]
		},
		{
			"type": "container",
			"id": "dbcontainer",
			"child":{
				"type":"repeat",
				"id": "db",
				"count": 16,
				"child": {
					"type": "box",
					"id": "dbbox",
					"label": "MySQL"
				}
			},
			"label": "DB Layer"
		}
	]
},
"edges": [
	{
		"src": "nginx",
		"dst": "webapp1"
	},
	{
		"src": "nginx",
		"dst": "webapp2"
	},
	{
		"src": "webapp1",
		"dst": "dbcontainer"
	},
	{
		"src": "webapp2",
		"dst": "dbcontainer"
	}
]
}