
The premise of this project was to create a visualization and simulation of flooded Google Street View images using Python, Flask and React. The landing page displays a map of flood risk, a search address bar, a flooded image of the address and relevant climate data associated to the query.
Address bar: The Google Map API address search Embeded map: A comprehensive map of flood risk Google Street View: A flooded image of the searched address Climate data: Relevant climate information for the address
- Welcome to Visualizing the Impacts of Climate Change!
- Technologies
- Infrastructure
- Visualizing the Impacts of Climate Change (VICC) Backend
Our project aims to raise awareness and conceptual understanding of climate change by bringing the future closer.
We will do this by developing an interactive website to depict accurate and personalized outcomes of climate change using cutting-edge techniques from artificial intelligence and climate modeling.
Bringing together researchers from different areas, we aim to design an educational tool that will produce accurate and vivid renderings of the future outcomes of climate change as they are likely to affect individuals.
An overview of the different technologies we are using for modeling, computing and rendering the outcomes of Climate Change on the backend Flask server.
CUDA® is a parallel computing platform and programming model developed by NVIDIA for general computing on graphical processing units (GPUs). With CUDA, developers are able to dramatically speed up computing applications by harnessing the power of GPUs.
In GPU-accelerated applications, the sequential part of the workload runs on the CPU – which is optimized for single-threaded performance – while the compute intensive portion of the application runs on thousands of GPU cores in parallel. When using CUDA, developers program in popular languages such as C, C++, Fortran, Python and MATLAB and express parallelism through extensions in the form of a few basic keywords.
The CUDA Toolkit from NVIDIA provides everything you need to develop GPU-accelerated applications. The CUDA Toolkit includes GPU-accelerated libraries, a compiler, development tools and the CUDA runtime.

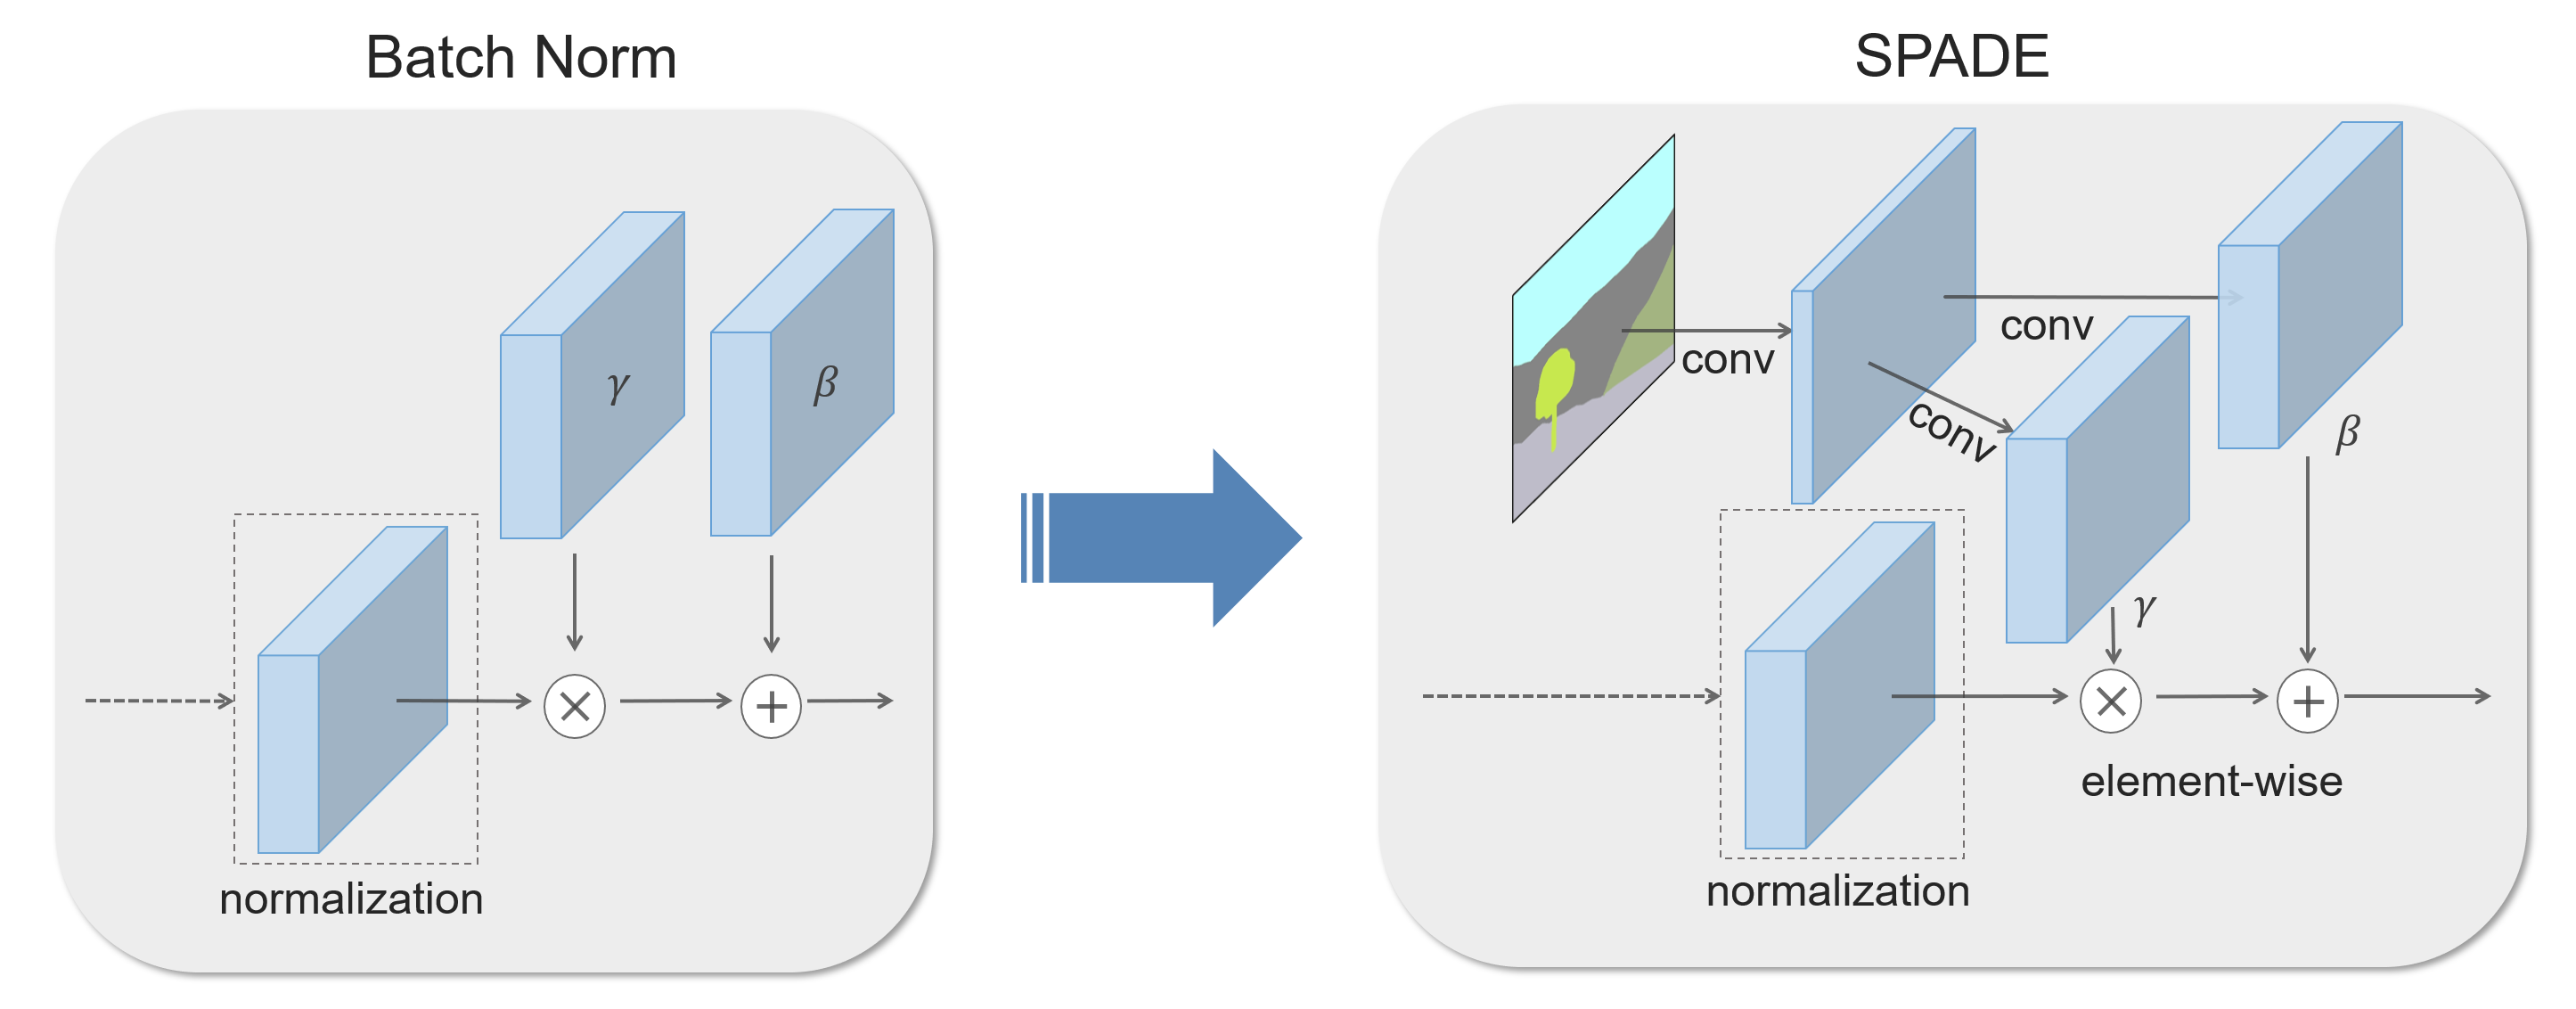
We propose spatially-adaptive normalization, a simple but effective layer for synthesizing photorealistic images given an input semantic layout. Previous methods directly feed the semantic layout as input to the deep network, which is then processed through stacks of convolution, normalization, and nonlinearity layers. We show that this is suboptimal as the normalization layers tend to "wash away’’ semantic information. To address the issue, we propose using the input layout for modulating the activations in normalization layers through a spatially-adaptive, learned transformation. Experiments on several challenging datasets demonstrate the advantage of the proposed method over existing approaches, regarding both visual fidelity and alignment with input layouts. Finally, our model allows user control over both semantic and style. Code is available at this https URL.
arxiv, 2019.
Taesung Park, Ming-Yu Liu, Ting-Chun Wang, and Jun-Yan Zhu.
“Semantic Image Synthesis with Spatially-Adaptive Normalization”, in CVPR, 2019.
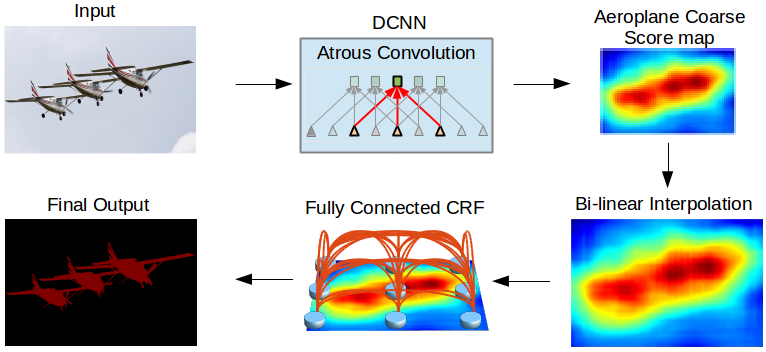
In this work we address the task of semantic image segmentation with Deep Learning and make three main contributions that are experimentally shown to have substantial practical merit. First, we highlight convolution with upsampled filters, or ‘atrous convolution’, as a powerful tool in dense prediction tasks. Atrous convolution allows us to explicitly control the resolution at which feature responses are computed within Deep Convolutional Neural Networks. It also allows us to effectively enlarge the field of view of filters to incorporate larger context without increasing the number of parameters or the amount of computation. Second, we propose atrous spatial pyramid pooling (ASPP) to robustly segment objects at multiple scales. ASPP probes an incoming convolutional feature layer with filters at multiple sampling rates and effective fields-of-views, thus capturing objects as well as image context at multiple scales. Third, we improve the localization of object boundaries by combining methods from DCNNs and probabilistic graphical models. The commonly deployed combination of max-pooling and downsampling in DCNNs achieves invariance but has a toll on localization accuracy. We overcome this by combining the responses at the final DCNN layer with a fully connected Conditional Random Field (CRF), which is shown both qualitatively and quantitatively to improve localization performance. Our proposed “DeepLab” system sets the new state-of-art at the PASCAL VOC-2012 semantic image segmentation task, reaching 79.7% mIOU in the test set, and advances the results on three other datasets: PASCAL-Context, PASCAL-Person-Part, and Cityscapes. All of our code is made publicly available online.
arxiv, 2017.
Liang-Chieh Chen, George Papandreou, Senior Member, IEEE, Iasonas Kokkinos, Member, IEEE, Kevin Murphy, and Alan L. Yuille, Fellow, IEEE
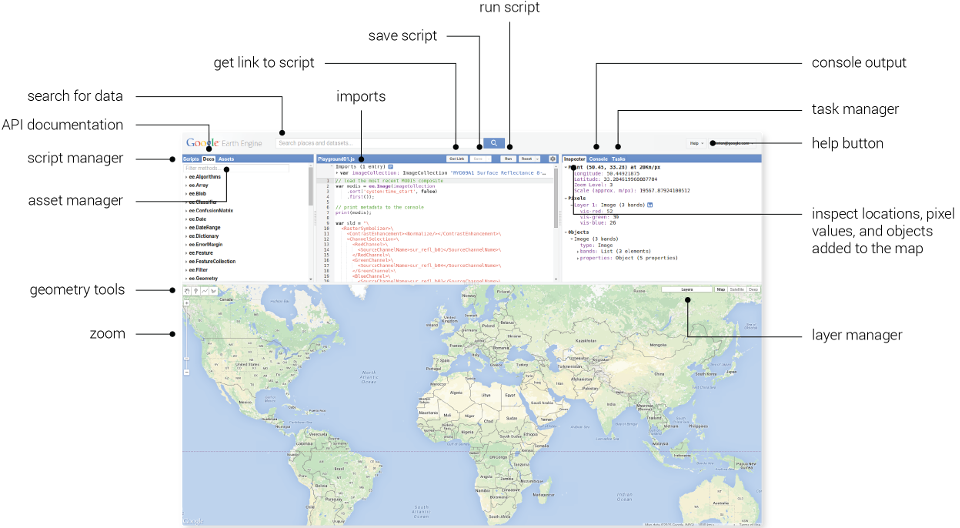
Earth Engine is a platform for scientific analysis and visualization of geospatial datasets, for academic, non-profit, business and government users.
Earth Engine hosts satellite imagery and stores it in a public data archive that includes historical earth images going back more than forty years. The images, ingested on a daily basis, are then made available for global-scale data mining.
Earth Engine also provides APIs and other tools to enable the analysis of large datasets.
The Maps JavaScript API lets you customize maps with your own content and imagery for display on web pages and mobile devices. The Maps JavaScript API features four basic map types (roadmap, satellite, hybrid, and terrain) which you can modify using layers and styles, controls and events, and various services and libraries.
All Visualizing the Impacts of Climate Change project infrastructure use components of Google Cloud Platform. The back end has been deployed on a GPU enabled Compute Engine instance.
GCP consists of a set of physical assets, such as computers and hard disk drives, and virtual resources, such as virtual machines (VMs), that are contained in Google’s data centers around the globe. Each data center location is in a region. Regions are available in Asia, Australia, Europe, North America, and South America. Each region is a collection of zones, which are isolated from each other within the region. Each zone is identified by a name that combines a letter identifier with the name of the region. For example, zone a in the East Asia region is named asia-east1-a.
This distribution of resources provides several benefits, including redundancy in case of failure and reduced latency by locating resources closer to clients. This distribution also introduces some rules about how resources can be used together.

The VICC project is an interdisciplinary project aimed at creating images of accurate, vivid, and personalized outcomes of climate change. Our goal is to use cutting-edge machine learning techniques to produce images of how neighborhoods and houses will look like following the effects of global warming. By creating a more visceral understanding of the effects of climate change, we aim to strengthen public support for necessary actions and motivate people to make impact decisions. As a prototype, we first focus on modeling flood consequences on homes.
For a more detailed motivation explanation, read through our 2 page executive summary.
This document has the following sections:
There are also the following documents which may be useful depending on your objectives:
- If you’re looking to build, run, extend, or test this codebase, you should check out the Contributor Guide.
This server is an API server written in Python using the Flask microframework. The server code is in ccai/ and the tests are in tests/. For more information on running the server, see the Contributor Guide.
From the initial address query to the flooded image rendering, the back & front end follows a process that uses configuration flags and a predefined pipeline.
FLOOD_MODEL = MODEL
ROUTE_MODEL = "model"
FLOOD_MODE = "all"
FLOOD_LEVEL = 0.4
RP = 50
MODEL_CONFIG_FILE = os.path.join(BASE_DIR, "nn/configs/config.yaml")
MODEL_CHECKPOINT_FILE = os.path.join(BASE_DIR, "nn/configs/gen_00060000.pt")
MODEL_WEIGHT_FILE = os.path.join(BASE_DIR, "nn/configs/resnet_34_8s_cityscapes_best.pth")
CLIMATE_DATA = "data/floodMapGL_rp50y.tif"
-
FLOOD MODEL::The model being use for generating the image (spade/deeplab)
-
ROUTE MODEL: The route of the API that connects to the front end
-
FLOOD MODE:: The type of flooded address mode being use for fetching the data, only default mode “all” is currently implemented, but the code is available for other modes in
ccai/climatefiles and can be activated on the back end.- "all": The address is flooded regardless of the risk.
- "closest": Will fetch the closest flood risk address according to coordinates
- "landmark": Will fetch the closest landmark in case of no flood risk.
-
RP: The return period, meaning the flood risk might occur within 50 years.
-
MODEL_CONFIG_FILE: The parameters used by the current model in a yaml file
-
MODEL_CHECKPOINT_FILE: The checkpoints of the model in a .pt file
-
MODEL_WEIGHT_FILE: The different weights being use by the current model
-
CLIMATE_DATA:: The Alfieri climate model to fetch the water level of lat/lon
If the user activates the geolocation on his browser, the complete flow will be launched automatically. The user can also enter another location in the address bar and hit the “go” button in order to query a different location. The pipeline goes like this:
-
fetch_climate_data(address): Returns all climate relevant data for the address entered on the front end.
- water_level: The water level of the latitude and longitude from the alfieri model
- shift: The new frequency in percentage that can affect the return period
- rp: the return period that is needed in the JSON response
- flood risk: The risk of flooding in percentage for the address
- hitory: The historical data of previous floods for the latitude/longitude
-
fetch_image(address): Using Google maps API, will fetch the address image
- image: The non flooded regular Google Street View Image in jpg format
-
create_temp_dir(images, temp_dir): Creates a directory to store the images temporarly
-
encode_image(temp_dir): encodes the Google Street View regular image for treatment using the model (spade/deeplab)
- path_to_gsv_image: The location of the Google Street View image in jpg format
- gsv_image_response: The encoded image in ascii format
-
model_launch(MODEL, MODEL_NEW_SIZE, MASK_MODEL, temp_dir, path_to_gsv_image): Uses the deep learning model to flood the image. Currently uses spade model with deeplab segmentation.
- path_to_flooded_image: The location of the encoded flooded image of the Google Street View jpg image previously fetched from fetch_image(address)
-
decode_image(temp_dir, path_to_flooded_image): Prepares the flooded Google Street View image for the JSON response.
- flooded_image_response: The actual flooded encoded image of the original Google Street View jpg
There it is, the pipeline in 6 steps that take place in webserver.py
For a thorough accounting of how to set up this repo and use the various developer tools that are setup, you can read the Contributor Guide. Alternatively, the following is a minimal set of commands that you can run to get up and running as quickly as possible:
Clone the repo:
mkdir -p ~/git
git clone https://github.com/cc-ai/floods-backend ~/git/floods-backend
cd ~/git/floods-backend
Install the Python dependencies into your current Python environment (should be at least Python 3.7):
pip install -r requirements.txt
Run a development server:
make develop
The API server will now be available at http://127.0.0.1:5000. See the API Endpoints section for available endpoints.
The server can also be launched using the command:
python3 -m ccai.bin.webserver
For persistent compute engine running server:
nohup python3 -m ccai.bin.webserver
Once you’re running the webserver locally, there are a few API endpoints that are available.
To download an unprocessed image as well as a flooded image and metadata, you can use the /flood/{model}/{address} endpoint. The model string must be a valid model that we have configured to flood images. At the time of this writing, the only supported model is munit. To download the content for Mila, you could run the following curl command locally:
curl localhost:5000/flood/MUNIT/6666%20St%20Urbain%20St%2C%20Montreal%2C%20QC%20H2S%203H1%2C%20Canada > images.json
This will return a response like:
response = {
    "original": gsv_image_response,
  "flooded": flooded_image_response,
  "metadata": {
        "water_level": {
             "title": " Expected Water Level (in CM):",
  "value": water_level,
  },
  "rp": {
            "title": " Return Period (in years):",
  "value": rp,
  },
  "flood_risk": {
            "title": " Flood Risk (in %):",
  "value": flood_risk,
  },
  "shift": {
            "title": " New Frequency (in %):",
  "value": shift,
  },
  "history": {
            "title": "Historical Data:",
  "value": history,
  },
  },
  }