A simple dashboard with Git statistics for teams and organizations. Currently in development, but operational. Is heavily based on git-pandas. The general architecture is:
- Flask for the app itself
- nvd3 for visualizations and stuff
- datatables for tables
- rq and redis for background tasks
The aim is to have a simple UI that can run on local host and visualize the interesting project-level analytics made possible by git-pandas. Current functionality is:
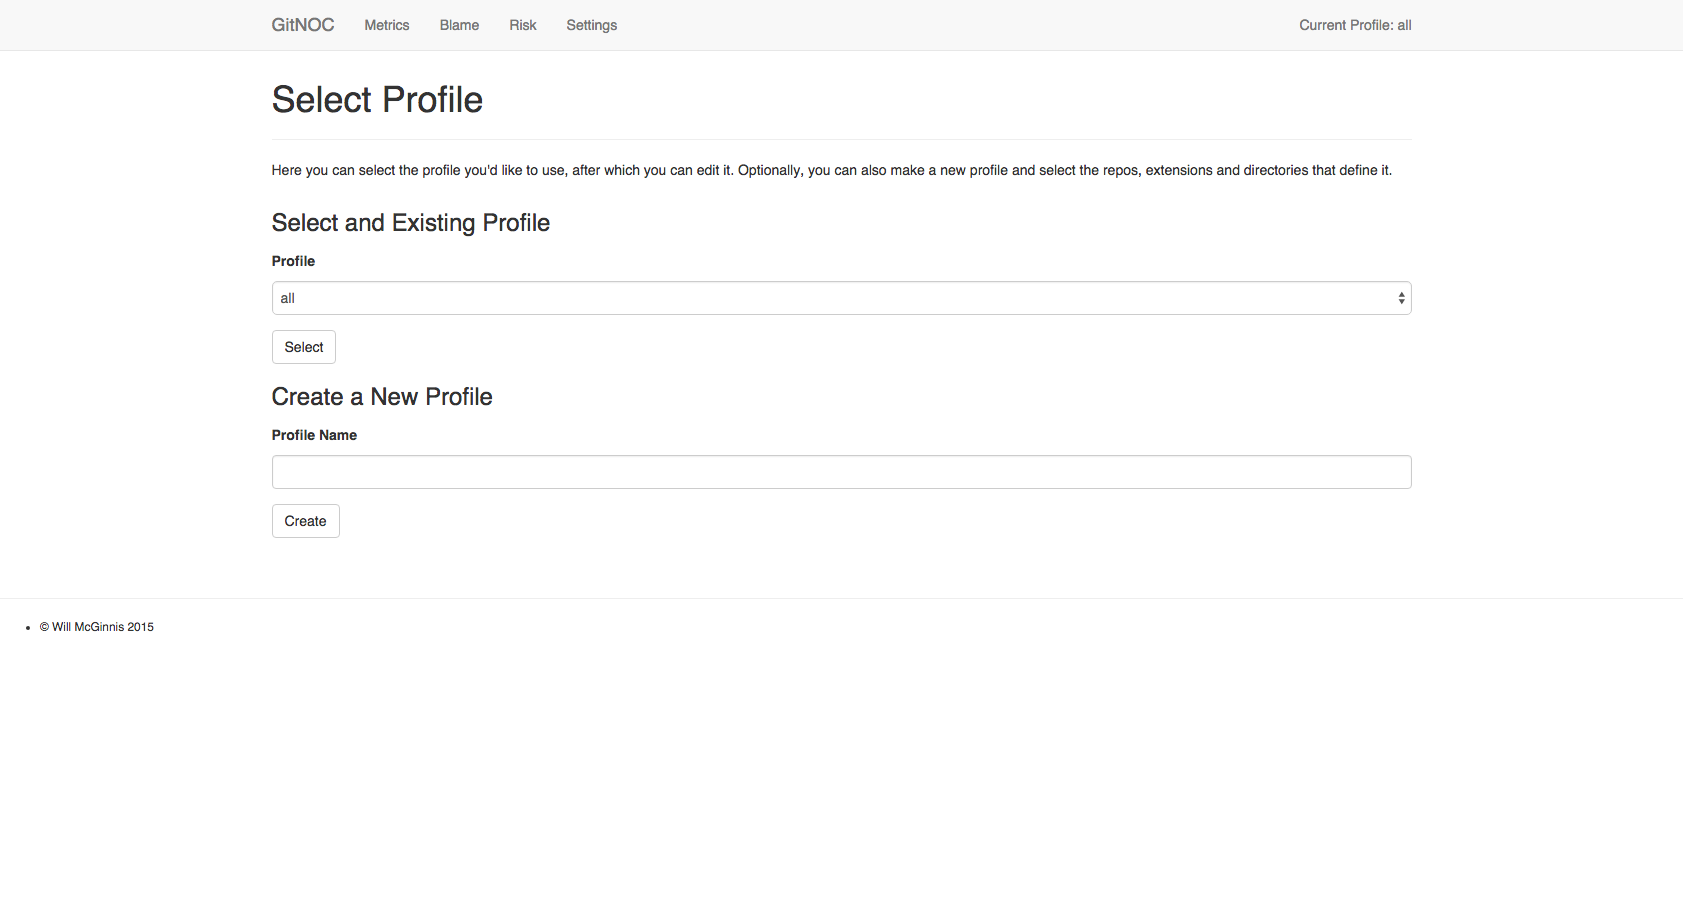
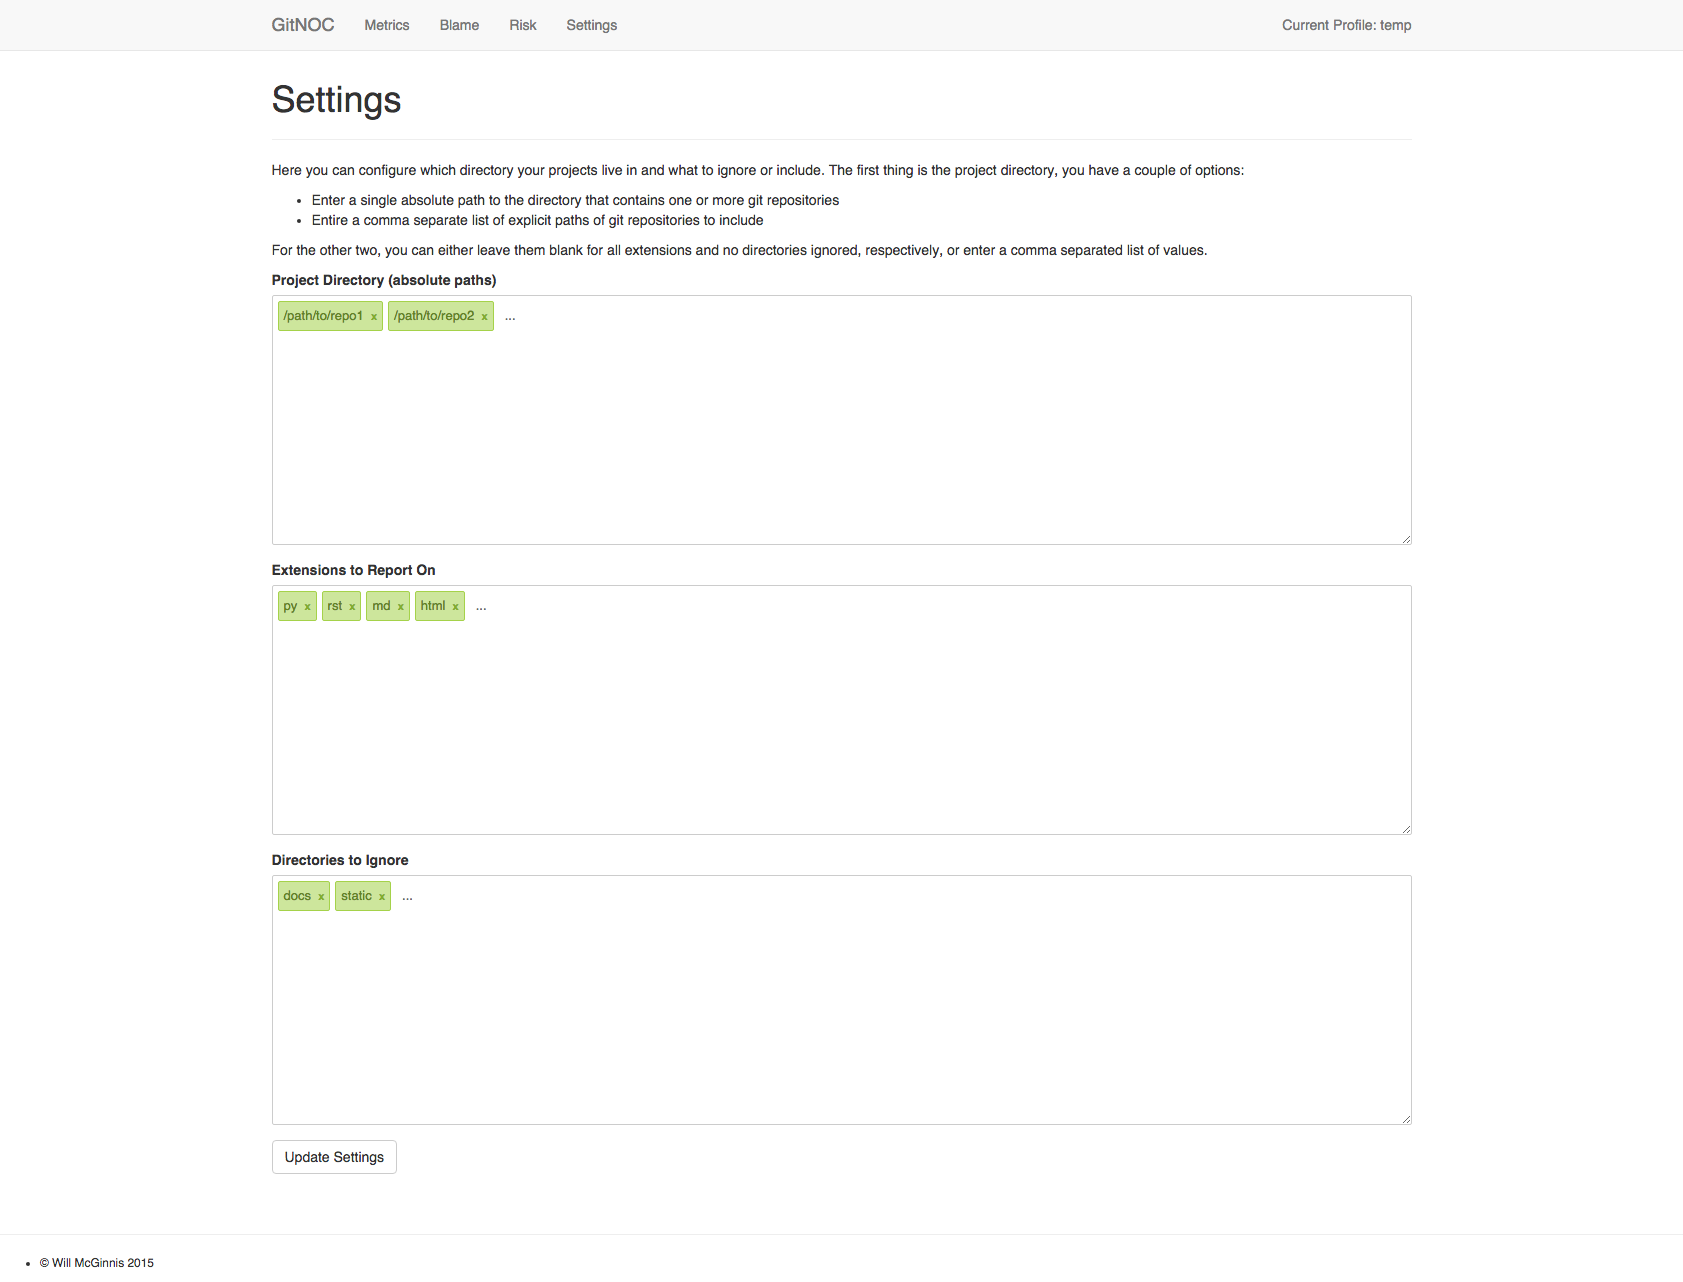
- Multiple settings profiles configurable, in each profile, you can set:
- a git repository or group of git repositories to analyze
- a set of file extensions to analyze
- a set of directories to ignore outright
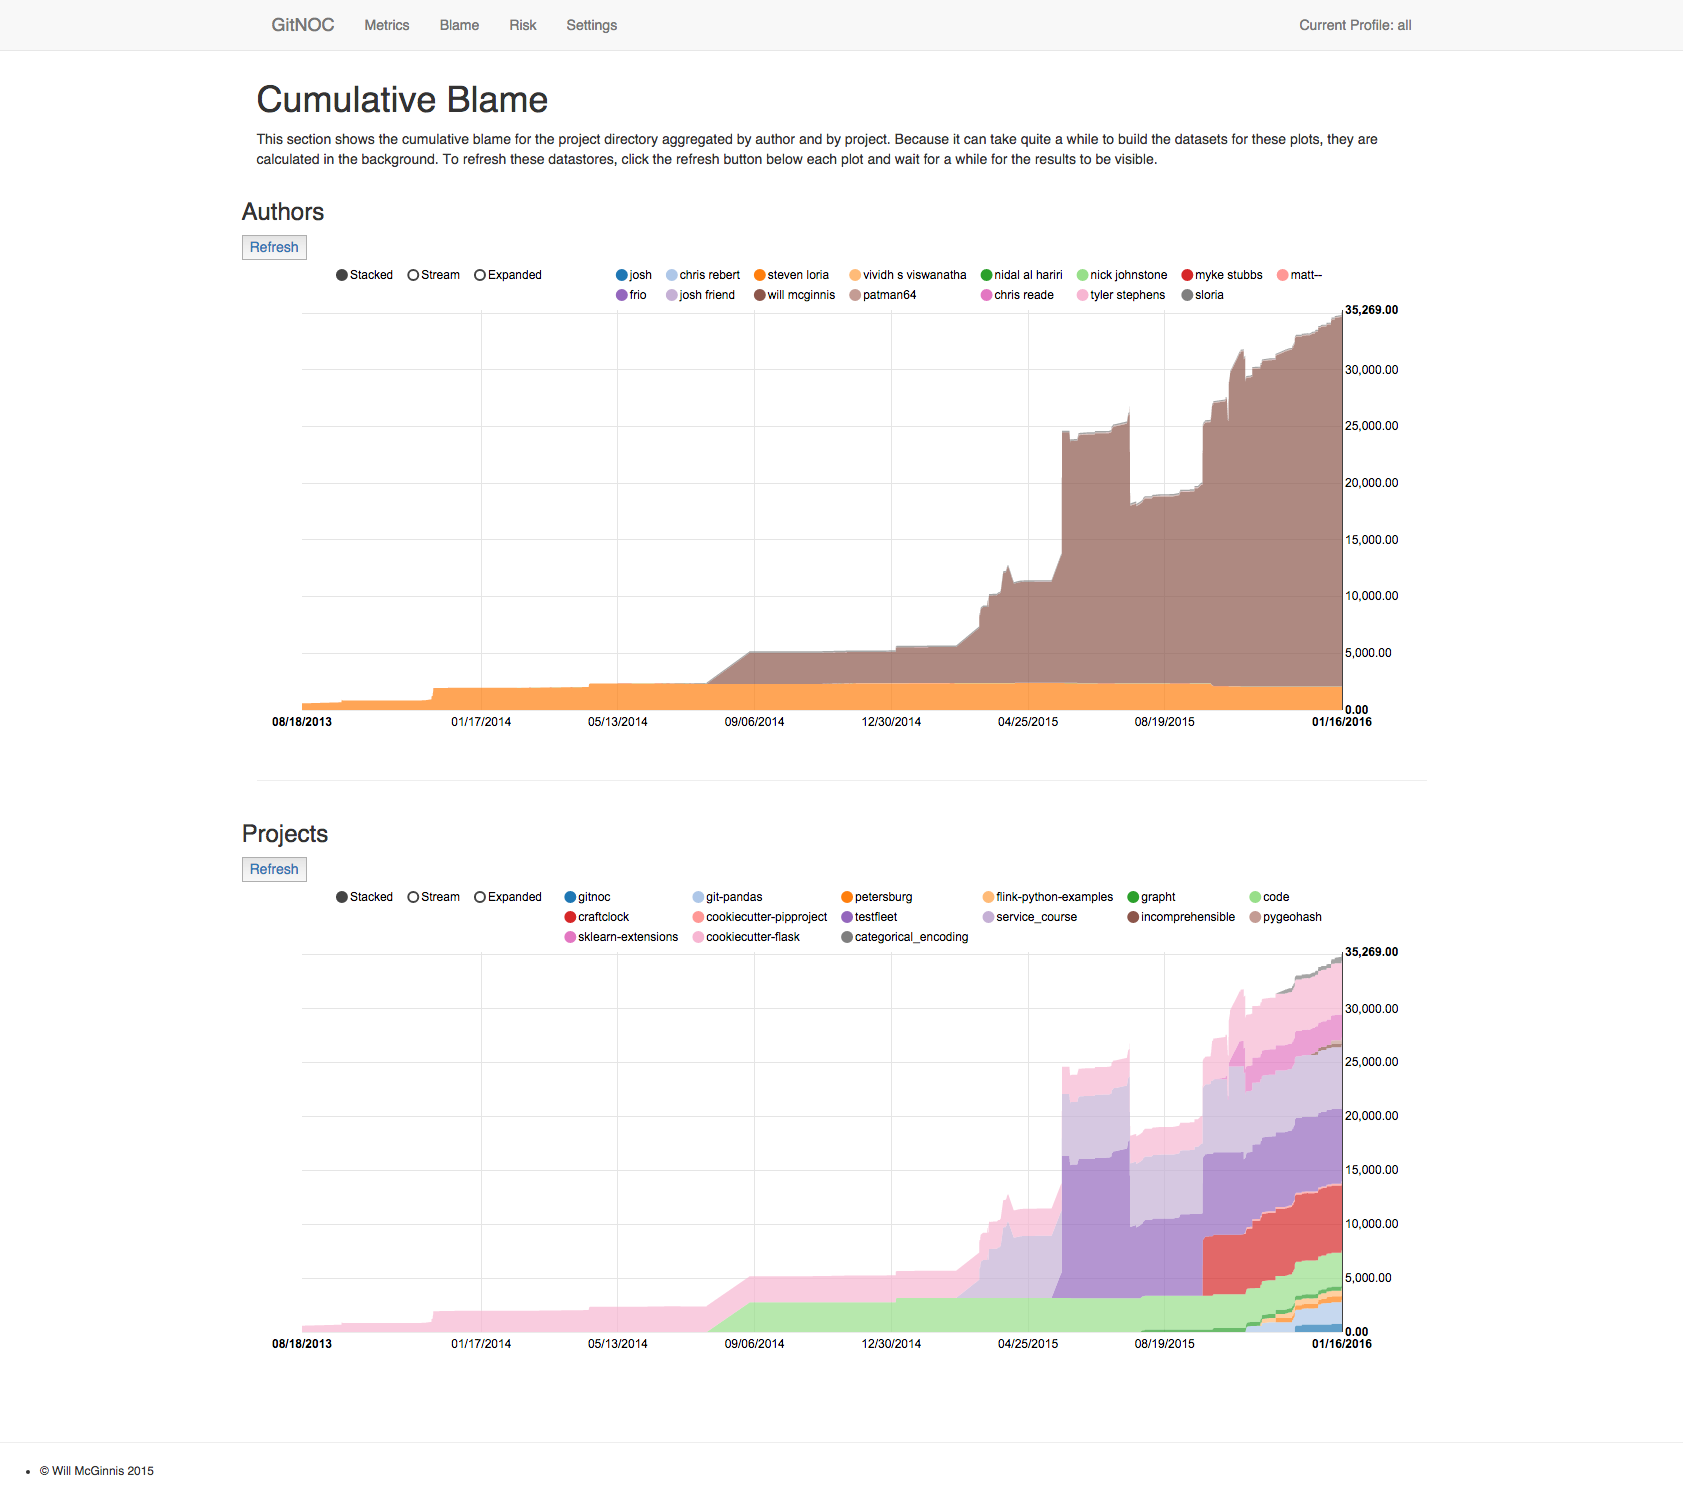
- Cumulative Blame (processing done in the background, can be slow for large repos)
- organized by committer
- organized by repository (if you have more than one repository in the profile)
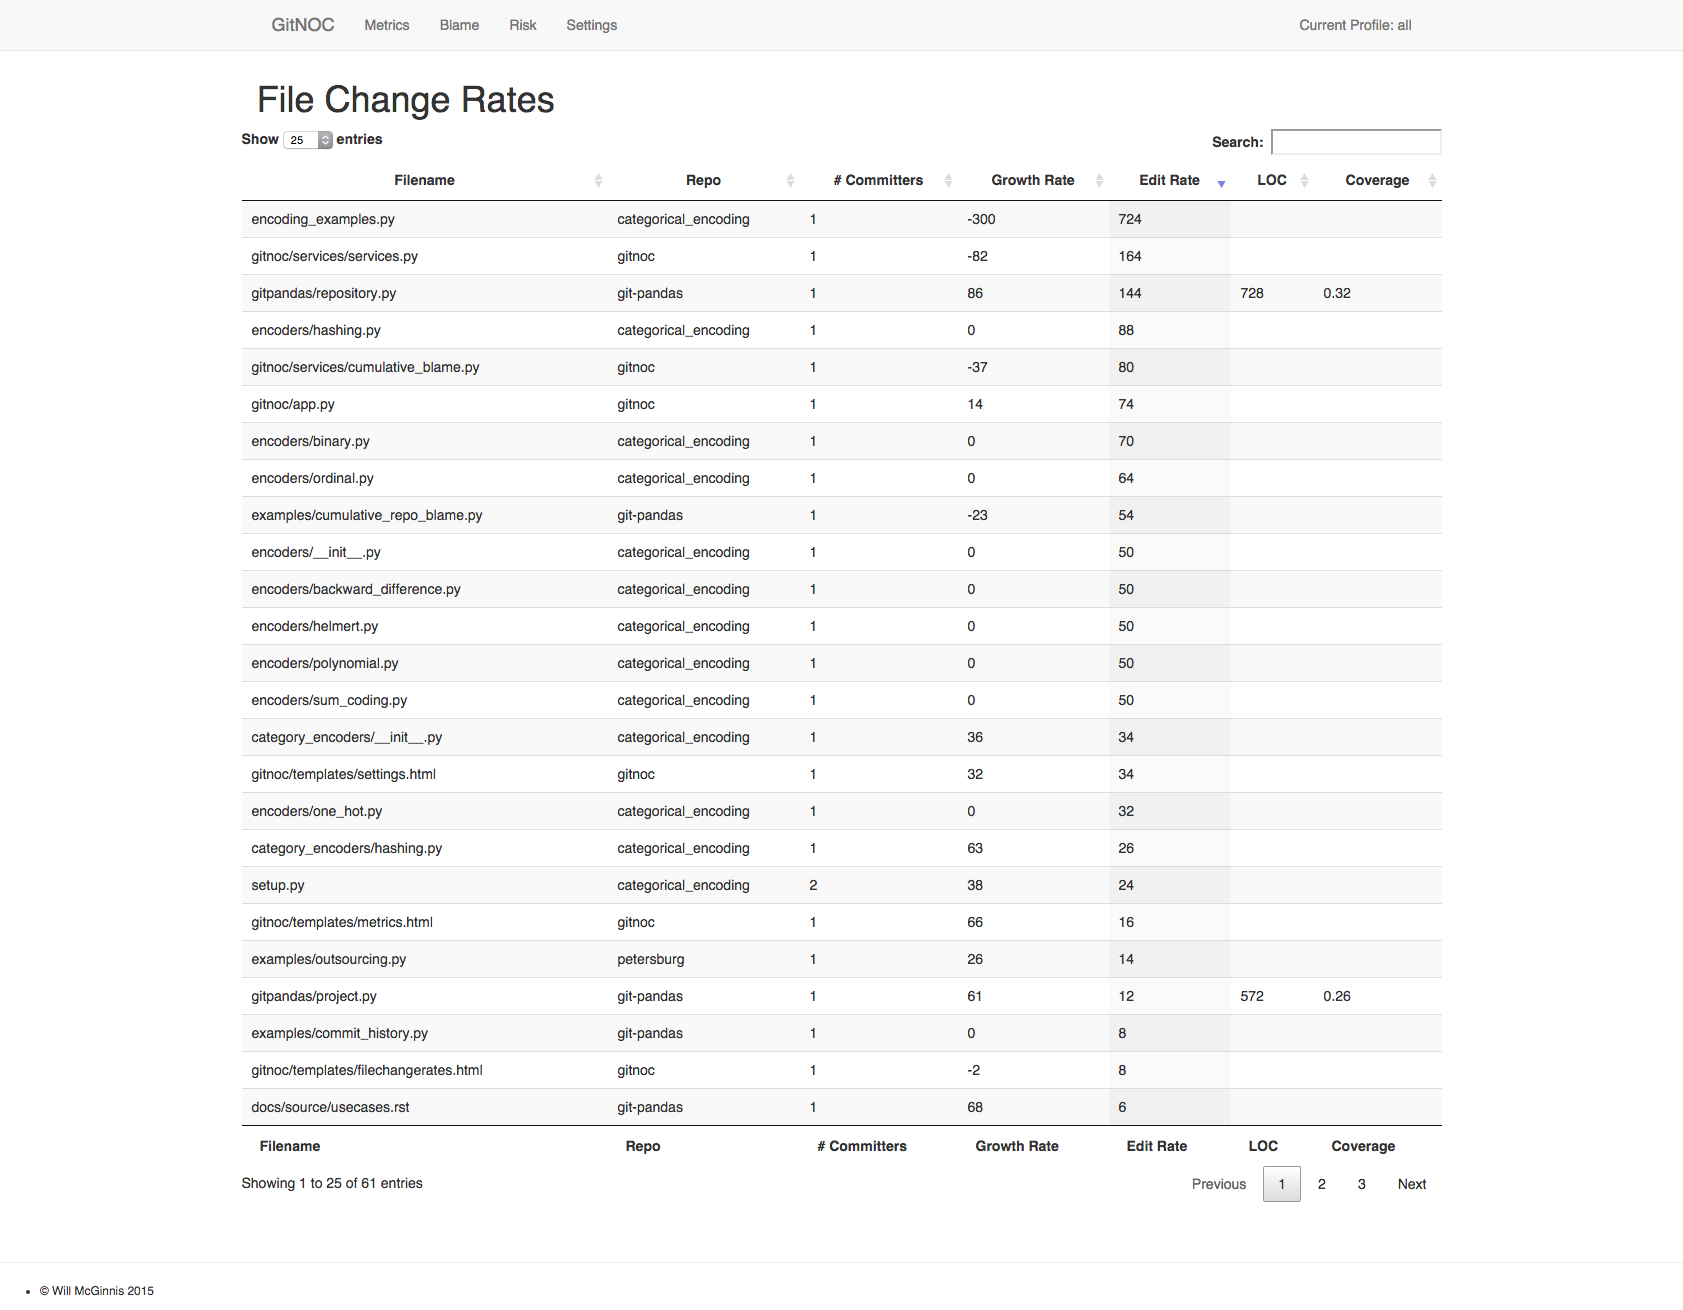
- File change rates (Risk measures)
- net change rate (total insertions - total deletions over time)
- abs change rate (total insertions + total deletions over time)
- edit rate (abs change rate - net change rate)
- coverage (if available)
- LOC
- Number of unique committers
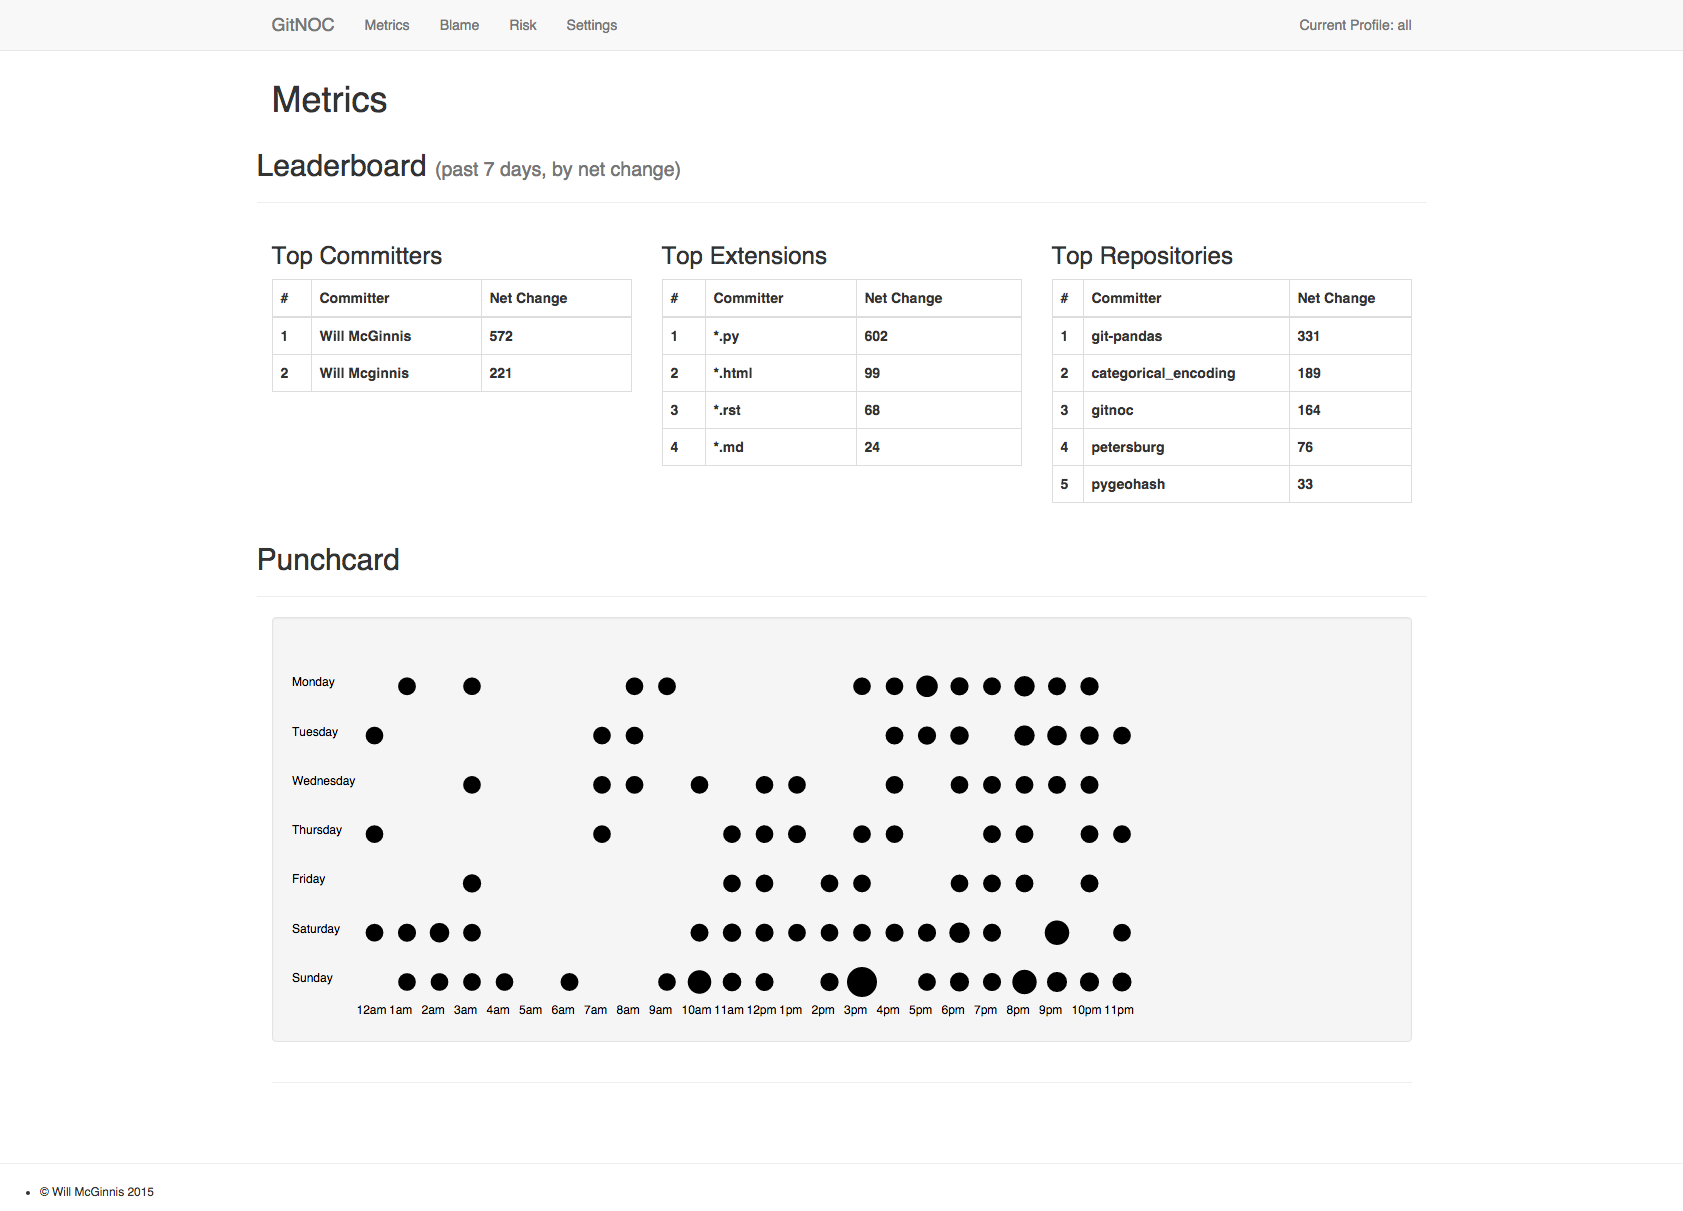
- Metrics Tab
- Leader board for top weekly committers, extensions, and repositories
- Aggregated punchcard for all projects in profile
In the future we aim to add more project level type of analysis for helping to manage groups of people all working in multiple git repositories towards some (hopefully) common goal.
TODO:
- When no data is found for graphs, put something telling the user that on screen
- When new data is being computed, put something telling the user that on screen
For the python component: set up a virtualenv then:
$pip install -r requirements.txt
For the web components:
$brew install node
$npm install -g bower
$bower install
For long tasks, we use redis and rq, so be sure to have a redis server up:
$brew install redis
$nohup redis-server &
Finally, to run, make sure you also have an rqworker running from this directory:
$rqworker