This is an scoring/inference add-on for Orange3. This add-on adds widgets to load PMML and PFA models and score data.
To use PMML models make sure you have Java installed:
- Java >= 1.8
- pypmml (downloaded during installation)
To use PFA models:
- titus2 (downloaded during installation)
To install the add-on using pip, run
pip install orange3-scoring
To register this add-on with Orange, but keep the code in the development directory (do not copy it to Python's site-packages directory), run
pip install -e .
Please raise an issue/question/request here.
Want to contribute? Great!
Please raise an issue to discuss your ideas and send a pull request.
After the installation, the widget from this add-on is registered with Orange. To run Orange from the terminal, use
python -m Orange.canvas
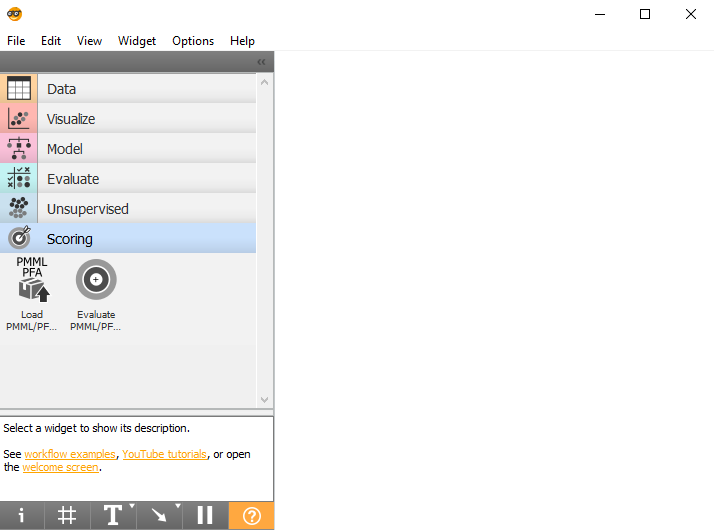
Step 1
The new set of widgets appear in the toolbox bar under the section Scoring.
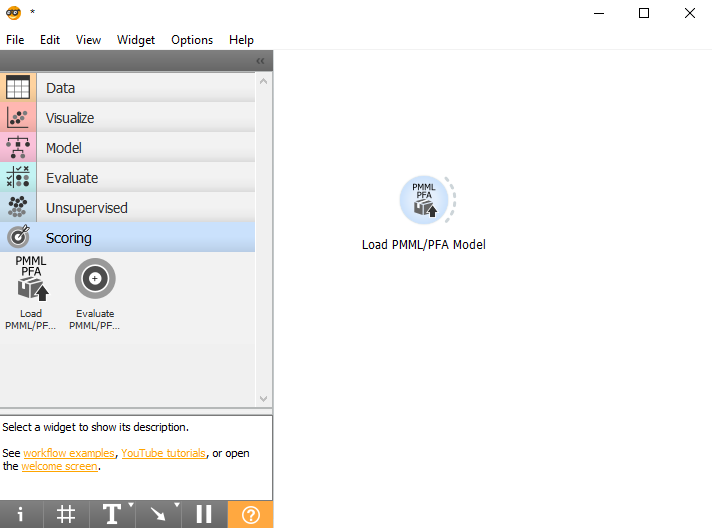
Step 2
Drag and drop the Load PMML/PFA Model widget.
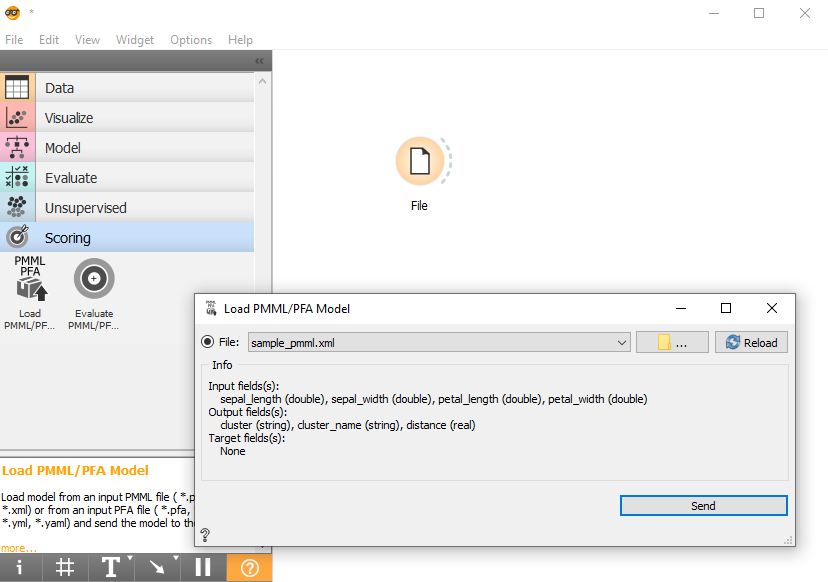
Step 3
Load your PMML model and inspect Input and Output field(s). Sample PMML File here.
Step 4
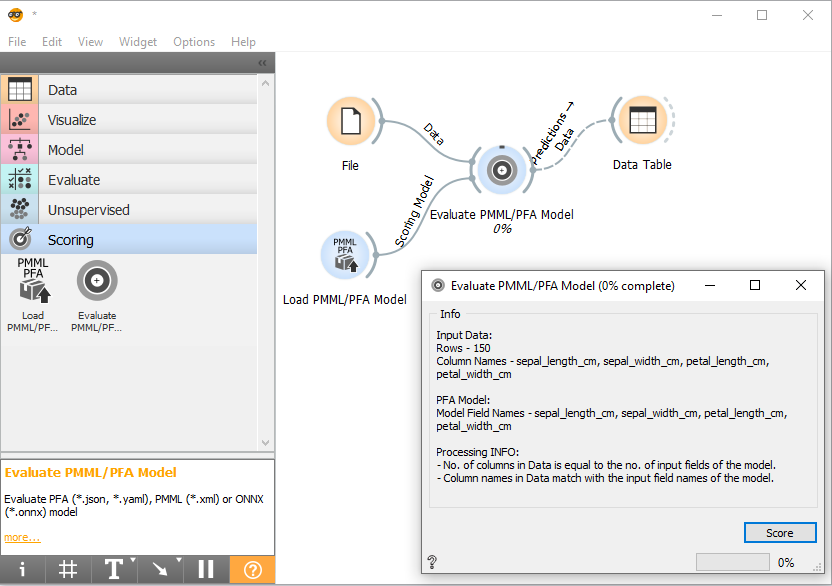
Add input dataset using File widget (iris) and connect the two widgets to Evaluate PMML/PFA Model widget. You can inspect the fields in data and the model and view Processing INFO or Errors.
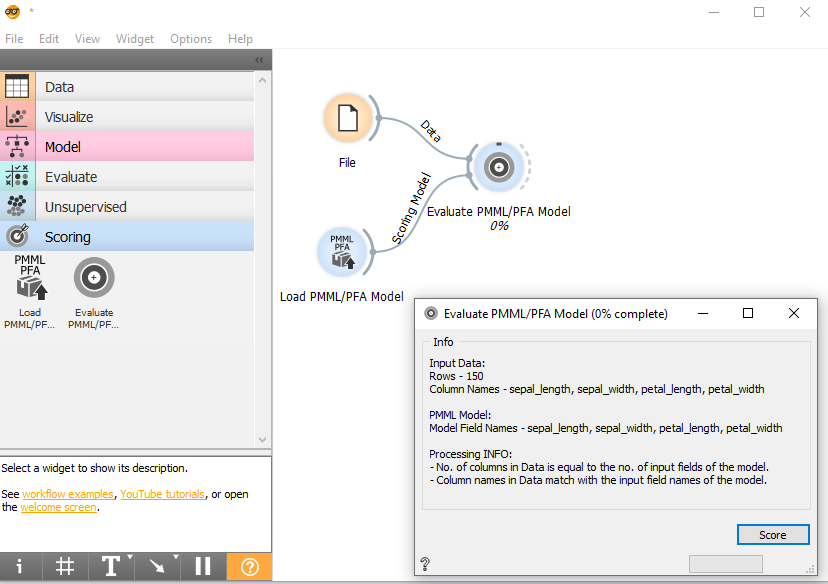
Step 5
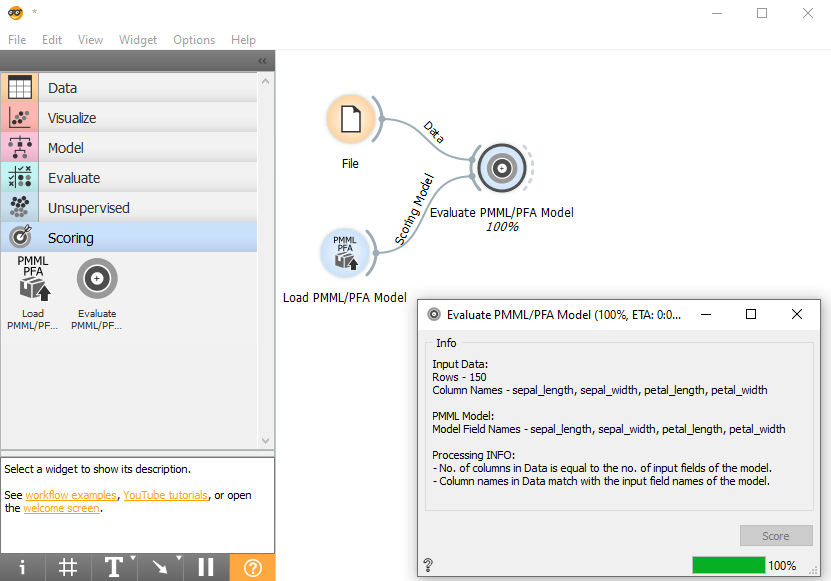
Now hit Score button to score.
Step 6
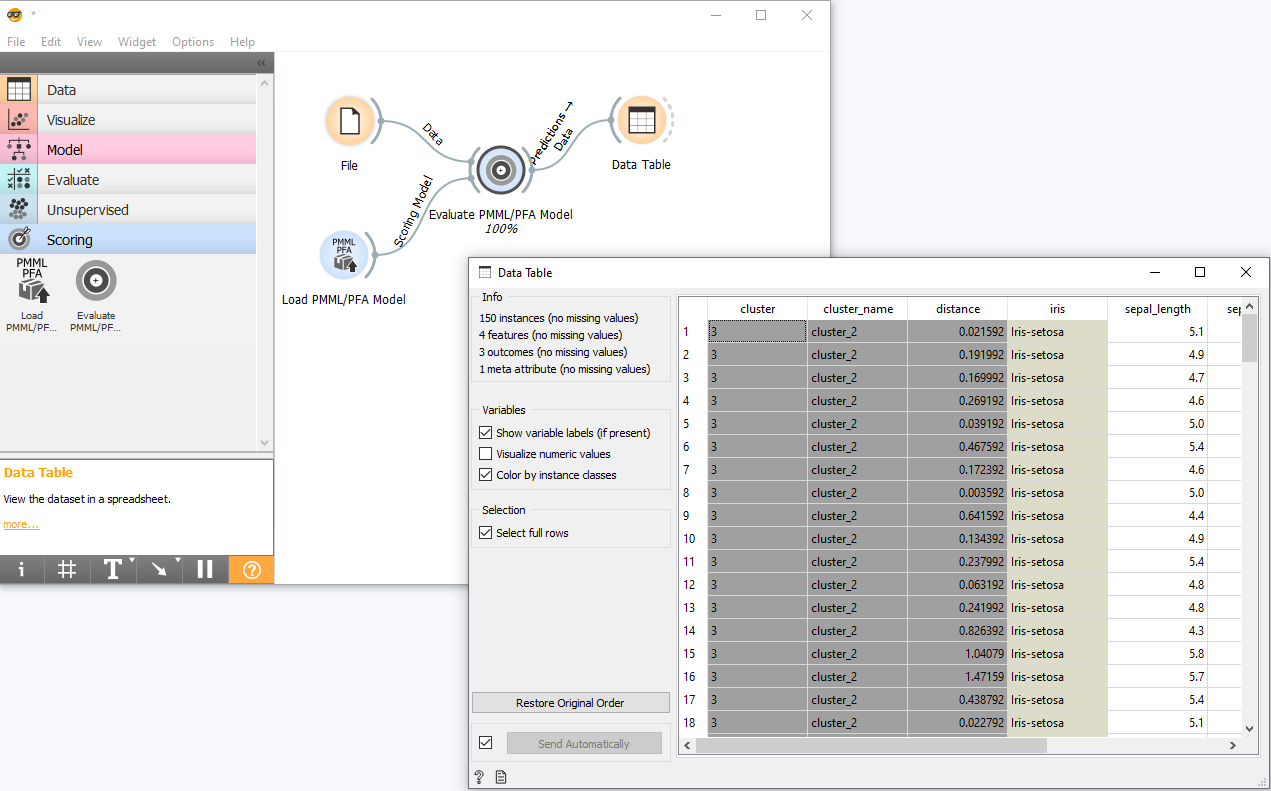
Connect the output to Data Table widget to view the results. 3 new columns (cluster, cluster_name & distance) are added after scoring the data obtained for each input record. The actual class value (Y), if present in the data, is also converted to metadata of the result table.
Step 7
Now lets load a PFA Model. Sample PFA File here.
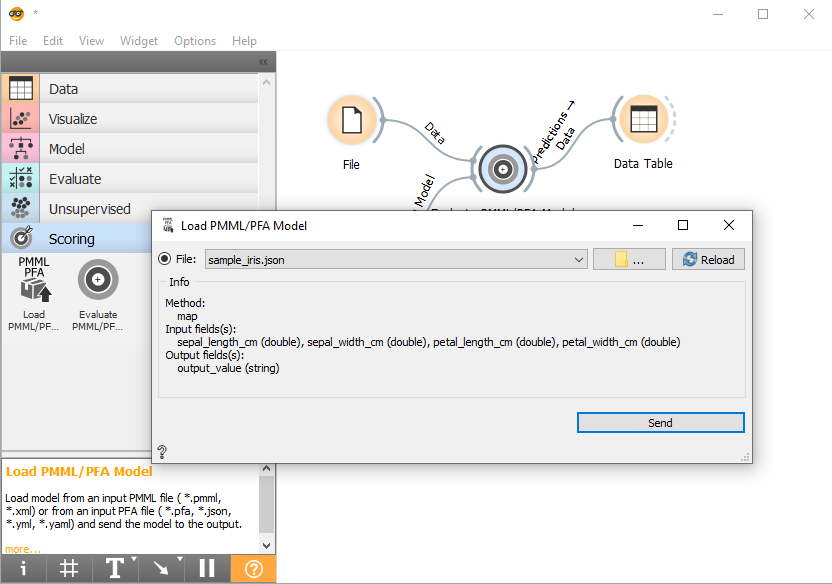
Step 8
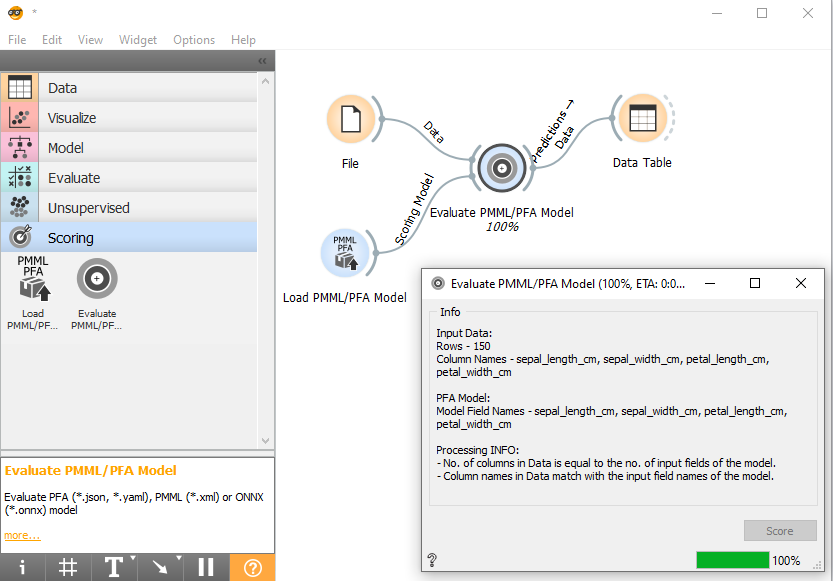
Score the data using new PFA Model.
Step 9
Now hit Score button to score.
Step 10
View the results. You can see the predicted class for iris as provided by the PFA Model.
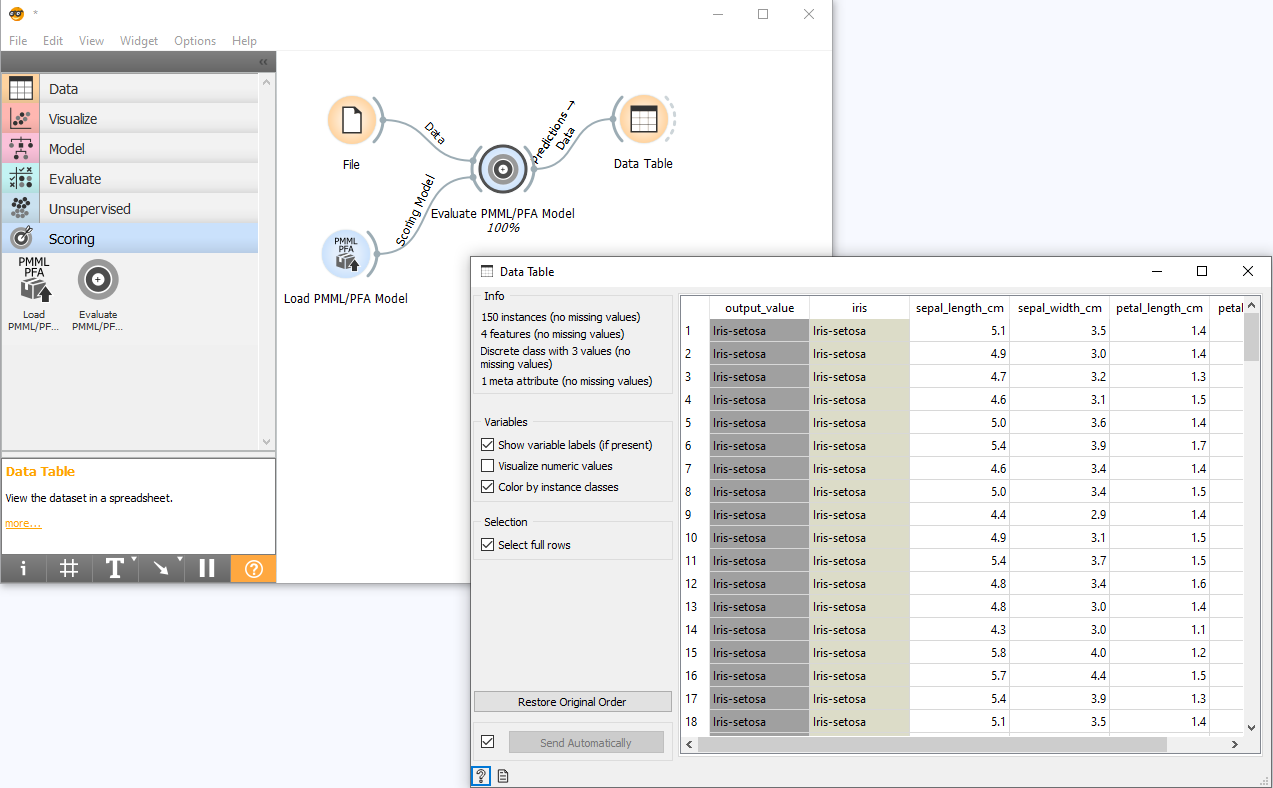
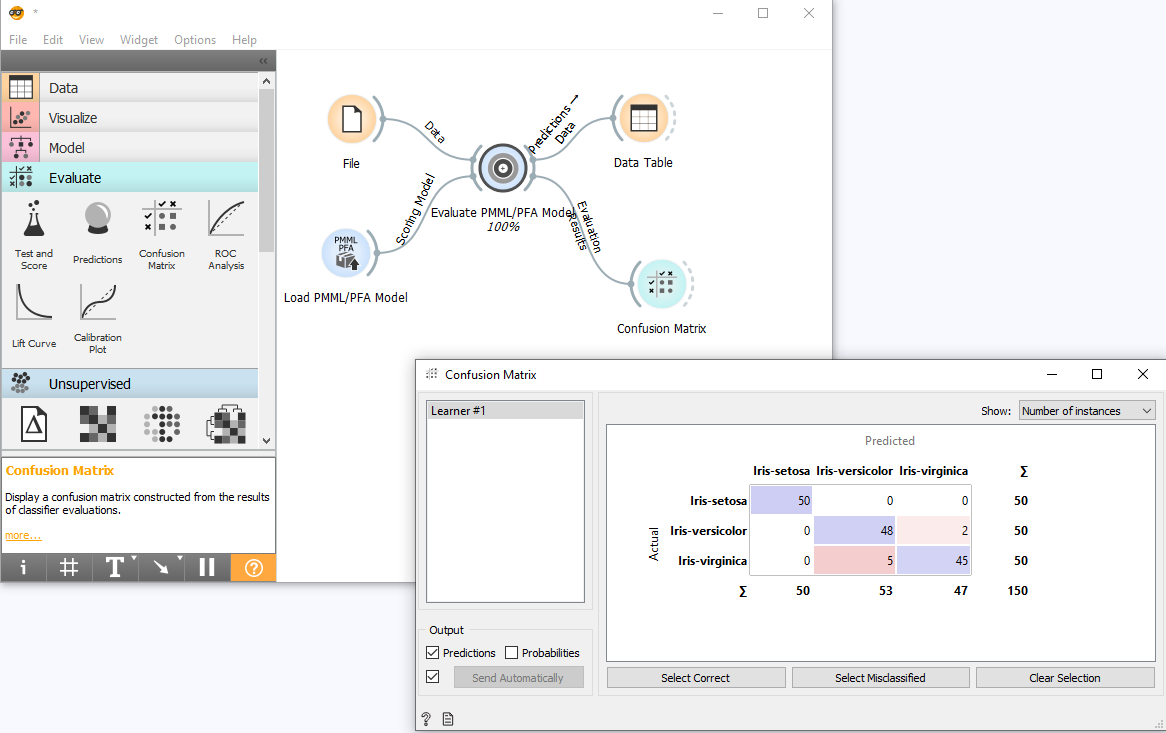
Step 11
Another output signal is produced which contains the Evaluation Results which can be connected to Confusion Matrix, ROC Analysis and Lift Curve widgets. We can connect it to the Confusion Matrix widget to view the difference in predicted and actual results.