dot-jenkins is a python tool that visualizes a Jenkins view using a Pimoroni Display-O-Tron (see: https://shop.pimoroni.com/collections/raspberry-pi/products/display-o-tron-hat)
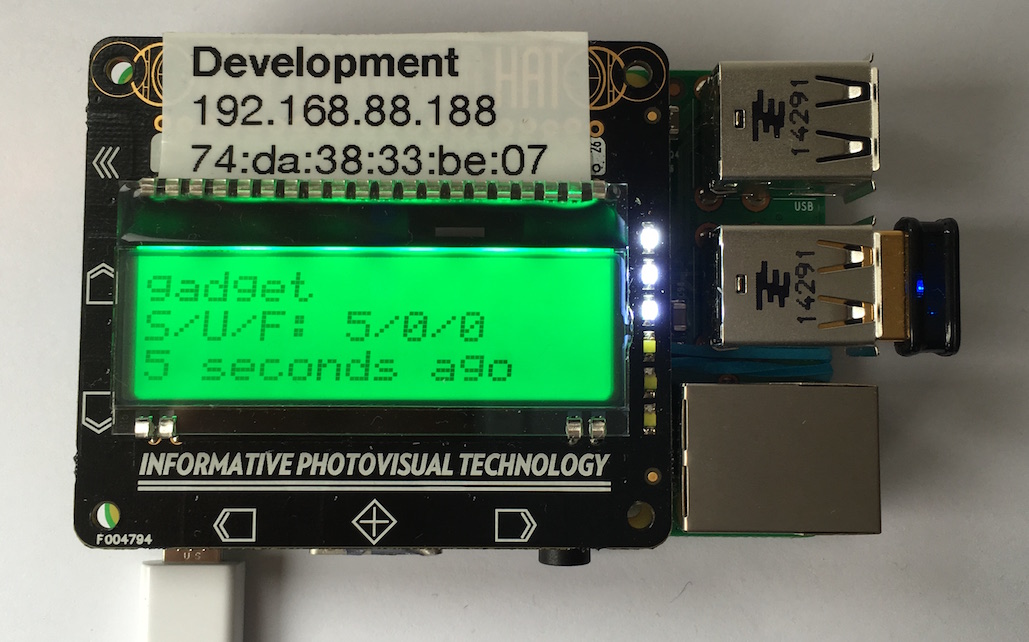
The default behavior is to display the number of succeeding (S), unstable (U) and failed (F) jobs in the view on the LCD. The LCD backlight is green if all jobs are succeeding and adjust to yellow and red if there are failed or unstable jobs. If there are failed or unstable jobs, they are shown one after the other.
Sample LCD outpuD:
myview
S/U/F: 3/0/2
10 seconds ago
The top three LEDs on the Display-O-Tron are used to convey the same information in a different fashion. All three LEDs lighting up means everything is ok, two of them means there are unstable jobs, and if only one is lighting up it means you have failing jobs.
The bottom three LEDs are currently unused and are waiting for interesting stuff to display. I'm open to suggestions. :-)
To get started, make sure you have set up the Display-O-Tron dependencies correctly using the Pimoroni scripts, see: https://github.com/pimoroni/dot3k
You also need to have the requests Python library installed. If you are using Raspbian, you can use pip install requests to get it.
If you're interested, there is an Ansible playbook for automating the setup in the ansible subdirectory. This can be useful if you are dealing with a lot of Pi's.
First you muste create a configuration pointing to your Jenkins instance and view. Make sure you do not forget to add /api/json to the end of the view URL.
An example configuration for Jenkins running on localhost:8080 and a view named myview, using no authentication:
{
    "viewUrl": "http://localhost:8080/view/myview/api/json",
    "viewRefreshInterval": 60,
    "viewRefreshErrorInterval": 60,
    "sslVerifyCertificates": false,
    "networkInterfaceName": "wlan0"
}
This example uses HTTPS and username/token authentication:
{
    "viewUrl": "https://jenkins.company.com/view/dot-jenkins/api/json",
    "viewRefreshInterval": 30,
    "viewRefreshErrorInterval": 60,
    "deltaTimeStep": 5,
    "sslVerifyCertificates": false,
    "networkInterfaceName": "wlan0",
    "username": "john",
    "authToken": "adf63446de6571dfa1"
}
The table below shows all possible configuration properties with their meaning and default values.
| Configuration Parameter | Description | Default Value |
|---|---|---|
viewUrl |
The URL of the Jenkins view (JSON API) | none |
username |
The username to use when authenticating with Jenkins. Leave unspecified if you do not want or need to use authentication. | none |
authToken |
The authentication token (= password) to use when authenticating with Jenkins. Leave unspecified if you do not want or need to use authentication. | none |
viewRefreshInterval |
The duration in seconds between refreshes of the Jenkins view | 30 |
viewRefreshErrorInterval |
The duration in seconds between refreshes of the Jenkins view, in case an error happened | 60 |
sslVerifyCertificates |
In case of HTTPS, indicate whether SSL certificate verification should take place. Set this to false if you are using a self-signed certificate, or a certificate from an untrusted CA. |
true |
networkInterfaceName |
The name of the network interface to use when displaying the device's IP address. | "wlan0" |
displayUpdateInterval |
The duration in seconds between display refreshes | 5.0 |
deltaTimeStep |
The increment in seconds to use when displaying the XX seconds ago information. |
10 |
Run Python with the controller.py script and specify your configuration on the command-line.
python controller.py -c my-config.cfg --debugTo automate this, a supervisord configuration is located in the the etc subdirectory. The configuration assumed that dot-jenkins was installed using the Ansible playbook, and is located in /opt/dot-jenkins and gets its configuration from /etc/dot-jenkins.cfg
The project includes a hardware fake, and uses it instead of relying on a RasperryPi and Display-O-Tron to be available. The hardware fake is used automatically if the controller.py scripts detects that it is not running on a RaspberryPi.