GO-Elite is designed to identify a minimal non-redundant set of biological Ontology terms or pathways to describe a particular set of genes or metabolites. Default resources include multiple ontologies (Gene, Disease, Phenotype), pathways (WikiPathways, KEGG, Pathway Commons), putative regulatory targets (transcription, microRNA, domains) and cellular biomarkers. See publication for more details https://www.ncbi.nlm.nih.gov/pmc/articles/PMC3413395/
This script takes a list or multiple list of protiens/genes and peforms the GO-elite anlaysis. It then produces a pdf output using R.
Dependencies
Python 2.7,
Further Documentation https://code.google.com/archive/p/go-elite/wikis
Before Starting Instructions
Unzip Ensure that GO-Elite/Databases/EnsMart62Plus/Hs/nested.7z is unzipped.
Input file The input file needs to be in csv format. The first row becomes the title of your protein list. This title can have letters, numbers, spaces of special characters. Note that the spaces and special charaters will be converted to "." in the output. Each column needs to have at least one offical gene smybol. We discussed making the requirment be at least three.
Background The background is a list of offical gene smybols in witch all other list/s are compared to determine enrichment of biological functions, struture motifs, or localization. This background list, if not specified is the column with the largest number of terms. The background must be larger than the list it is being compared too. I must also contain every gene that is found in any other column.
Instructions First rename GO_Elite_2-master to GO-Elite_v.1.2.5-Py
Then under the Database folder add the databases found at ......
There are two ways to run this pipeline.
- Use the R script to parse the data and prep it for GO-elite
- Use the prepared data in the "Example_inputs_GO_Elite" folder.
For methond one simply set your working directory in R using setwd("your\file\path") Then run the script the output should be identical to the contents of Example_outputs
For method two open a new session in R and enter the following command
system("C:/Python27/python C:/Users/bishofij/Proteomics_Pipeline/GO-Elite_v.1.2.5-Py/GO_Elite.py --species Hs --mod Ensembl --permutations \"FisherExactTest\" --method \"z-score\" --zscore 1.96 --pval 0.05 --num 5 --input C:/Users/bishofij/Proteomics_Pipeline/go-elite_r_projects/test_inputs4/ --denom C:/Users/bishofij/Proteomics_Pipeline/go-elite_r_projects/test_inputs4/background/ --customSet C:/Users/bishofij/Proteomics_Pipeline/GO-Elite_v.1.2.5-Py/Databases/EnsMart62Plus/C2/ --dataToAnalyze all --output C:/Users/bishofij/Proteomics_Pipeline/go-elite_r_projects/test_inputs4/")Alternatively you can run straight from command line with the following.
/Python27/python GO_Elite.py --species Hs --input test_inputs4/ --denom test_inputs4/background/ --customSet Databases/EnsMart62Plus/C2/ --output test_inputs4/Not sure what this is?
$ python2 GO_Elite.py --species Hs \
--mod Ensembl \
--permutations "FisherExactTest" \
--method "z-score" --zscore 1.96 --pval 0.05 \
--num 5 \
--input test_installation/test_inputs/ \
--denom test_installation/background/ \
--customSet test_installation/db \
--dataToAnalyze all \
--output test_installation/demo_outs
Steps of the pipeline
- Set variables. These include file name, file path, output folder, Species, Bars per ontology, and more.
- Step two breaks down the csv input file into seperate txt files. It seprates the columns into sperate txt files. It also detect the column witht the longest list and seprates that into a txt file called background. The background.txt is place into the background folder.
- Now that the input has been parced and all the parameters have been set. It is now time to run GO-elite. A command is created in then pasted into command promt. This command calls upon python and GO-elite. It also tell GO-elite what paramteres to use. The resuts from the analysis can be found in the folder GO-Elite_results. An exsample of the command to set to command prompt: C:/Python27/python C:/Users/bishofij/Proteomics_Pipeline/GO-Elite_v.1.2.5-Py/GO_Elite.py --species Hs --mod Ensembl --permutations "FisherExactTest" --method "z-score" --zscore 1.96 --pval 0.05 --num 5 --input C:/Users/bishofij/Proteomics_Pipeline/go-elite_r_projects/test_GO/ --denom C:/Users/bishofij/Proteomics_Pipeline/go-elite_r_projects/test_GO/background/ --customSet C:/Users/bishofij/Proteomics_Pipeline/GO-Elite_v.1.2.5-Py/Databases/EnsMart62Plus/C2/ --dataToAnalyze all --output C:/Users/bishofij/Proteomics_Pipeline/go-elite_r_projects/test_GO/
- The third step is pefromed compeletely in R. The results produced in step two are now graphed and placed into a pdf.
1)"fileName" This is the name of .csv table that contains protein/gene names. (set by user)
2)"filePath" This sets the working directory. (set by nephele?)
3)"outFilename" This is the name of the folder where the data will be saved. Current this is set up to be file/path/outfilename . Not sure how exactly this will work in the context of nephele. (set by nephele?)
4)"GOeliteFolder" the location of the GO-elite.py file. (constant)
5)"maxBarsPerOntology" Number of terms or bar per the ontology (constant for now)
6)"speciesCode" Hs for homo sapiens, Dm for fly; Mm, mouse; Rn, rat (set by user)
7)"pythonPath" Location of python version 2.7 (constant)
1)"fileName" This is the name of .csv table that contains protein/gene names. (set by user)
2)"filePath" This sets the working directory. (set by nephele?)
3)"outFilename" This is the name of the folder where the data will be saved. Current this is set up to be file/path/outfilename . Not sure how excatly this will work in the context of nephele. (set by nephele?)
4)panelDimensions The number of rows and columns for each page of PDF output (constant for now)
5)"color" The colors of the bar graphs. Must be valid R colors. (constant for now)
Source code for GO-elite (https://code.google.com/archive/p/go-elite/downloads) See "GO-Elite version 1.2.5 dev -Python Source Code"
GO-Elite code and databases used for Nephele analysis can also be found here: https://github.com/niaid/GO-Elite
Location of Database (http://software.broadinstitute.org/gsea/msigdb/genesets.jsp?collection=C2)
Database information EnsMart refers to the database version name used by GO-Elite. This is the standard database version type available by default. EnsMart indicates that the database relationships are primarily derived from Ensembl, the build number indicates the build of Ensembl (e.g., version 58). If the suffix "Plus" is present, this indicates additional Affymetrix-EntrezGene and Affymetrix-Ensembl relationships are included, derived from the source Affymetrix CSV annotation files for all arrays for that species. In addition to these Affymetrix relationships, Entrez-GeneOntology relationships from the NCBI are also included.
How does GO-Elite deal with multiple gene ID mappings? Answer: Some GO-Elite input identifier (ID) systems, such as Affymetrix probesets can have a single ID that maps to multiple genes or multiple primary IDs which maps to a single gene (e.g. Ensembl). By default, GO-Elite has two primary gene relationship identifiers linked to GeneOntology and pathways terms. These are Ensembl and EntrezGene. All other identifiers must link to one of these two systems in the database to be used. Since the database is built primarily from the Ensembl database, most all secondary systems (e.g, Affymetrix, Unigene, RefSeq, Uniprot) are mapped to Ensembl but not necessarily EntrezGene.
One of the main functions of GO-Elite's over-representation analysis (ORA) is to not count an input ID, such as probeset, more than once for a GO-term or pathway. This philosophy minimizes falsely over-weighted results.
Below is the schema which GO-Elite's ORA function uses to build unique primary ID and gene to GO/pathway associations. These methods are largely similar to the program MAPPFinder 2.0's (a component of GenMAPP version 2), implementation. The below schema is illustrated for Affymetrix probesets.
Import all probesets for a given input gene set and denominator gene set. Link the probesets to gene IDs (e.g. Ensembl) via the 'Ensembl-Affymetrix.txt' file in the 'uid-gene' Database species directory. Import the gene to GO relationships (e.g. 'Ensembl_to_Nested-GO.txt' in 'nested'). Send the denominator gene-probeset relationships (where the gene is the unique ID or key) and gene-nested GO relationships to the mappfinder.py function 'countGenesInPathway'. For each gene in the gene-nested GO table, store the unique set of probsets corresponding to the gene ID for that gene with that GO term. Repeat the same process with just those IDs found in the input criterion file. This should produce the following theoretical results: If gene 1 maps to Probeset X and Probeset Y, store 'GO_count_dbGO_term = X, Probeset Y'. For each GO term examined determine the number of unique sets of probesets linked to genes (rather than count unique gene IDs count unique probeset lists). Also store this probeset list (X, Probeset Y) for each gene as the key in another database to find how many unique sets of probesets there are corresponding to genes (unique gene count linked to GO). (scenario 1) If you have the genes 1 and 2, that both match to probesets X and Y, the list of probesets X,Y will be counted once for each GO term and in the total number of genes linked to GO.
(scenario 2) If you have two genes, 1 and 2 and X associates with 1 and X & Y associate with 2, then two unique genes are counted.
For scenario 1, if only probeset X is in your input list, then only one gene is count (since X becomes the unique ID for both genes, and doesn't consider Y). For scenario 2, although gene 2 links to X & Y, since only X is present genes 1 and 2 are counted only once, since both ONLY link to X.
GenMAPP's MAPPFinder seems to implement a similar strategy (we've compared results but not the VB code), but only for the criterion probeset-gene relationships. For the denominator, it appears that the program counts the number of unique Ensembl's linked to probesets, even if the associations are redundant. Some people I prefer the GenMAPP method, however, for GO-Elite we decided to calculate the numerator and the denominator using the same method.
How do I cite GO-elite? Orginal paper (https://academic.oup.com/bioinformatics/article/28/16/2209/325325) One-Step GO-ELITE WITH USER PARAMETERS was developed by - by Eric Dammer, Divya Nandakumar Under the supervisoion of the PI Dr. Nicholas Seyfried
GO-Elite Output File Descriptions Introduction Four primary file types are exported by GO-Elite with the completion of each run. These include:
Over-representation analysis (ORA) results (aka MAPPFinder output) Pruned ORA results (aka summary output) Gene annotation file Gene ranking file Each one of these files is created for each input user gene list Gene Ontology (GO) and local pathway results. Since many files can be created when a user is analyzing multiple gene lists, an additional combined file is created for files 2, 3, and 4, which will contain all criterion analyzed in a single run, including GO and local results together.
File Descriptions ORA results
This file is similar to that produced by the program MAPPFinder 2.0, a component of the application GenMAPP version 2. For each GO-Elite analysis, both a GO and local ORA results file are created and saved to the folder “input/MAPPFinder”, in a sub-folder with the appropriate time stamp (e.g., “archived-Jul 03 21.48.54 2008”). These files have the same name as the input gene list with the addition of the suffix “-GO.txt” or “-local.txt”. Information on the date of the OBO files used, number of gene identifiers (IDs) in the user input file, number of genes linked to GO or pathways, and input file name are reported at the top of this file (Figure 1).
Figure 1 http://genmapp.org/go_elite/images/ge_1.jpg
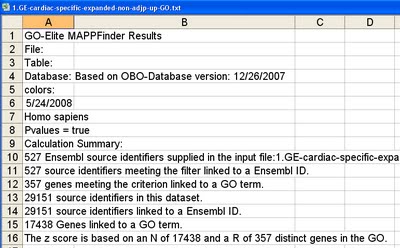
The main contents of this file are GO or pathway names, IDs, number of genes changed, number of genes associated with each term, z-scores, permutation p-values, and Benjamini-Hochberg adjusted p-values (Figure 2). There are also a number of blank columns. These would typically contain non-nested GO gene associations, which are not currently calculated in GO-Elite. These ORA results are further pruned by GO-Elite to report a minimally redundant set of ORA terms.
Figure 2 http://genmapp.org/go_elite/images/ge_2.jpg
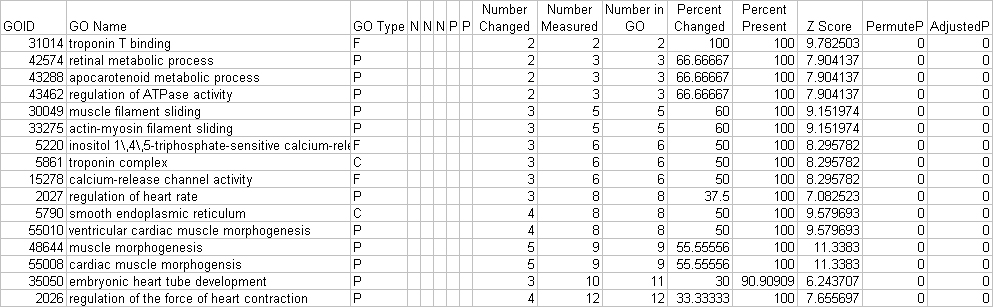
Pruned GO-Elite ORA summary results
The pruned ORA files are stored to the folder "output" with the same name as the original input gene ID file with the suffix pruning algorithm + "elite.txt". Pruning algorithms include "z-score", "gene-number", and "combination". These results contain the main statistics from the ORA file for only Elite identified terms, along with gene symbols associated with each term, terms that have genes entirely redundant with the listed terms, and the inverse associations. Optionally included are mean statistics that are associated with each input gene ID and term.
Gene annotation files
These files contain all GO and pathway terms listed in the pruned ORA summary result’s file along with associated input gene IDs and gene annotation information. These files are saved in the "output/gene_associations" folder with the suffix "-gene-associations.txt". Each line in this file consists of a gene name, symbol, primary ID, source IDs, GO term or pathway and associated user-data in the input file.
Gene ranking files
These files contain all genes listed in the GO-Elite gene-association file, the number of pruned ORA summary terms associated with that gene, percentage of terms the gene is associated with, and associated terms are listed on each line. These genes are listed in descending order, based on the number of terms each is associated with this. Unlike the gene-association files, each gene is only listed once. This file can be used determine which sets of genes may be over-represented among GO-Elite terms.
Combined files
The combined files for pruned ORA results, gene association, and gene ranking files are stored into a single file for each of these three categories. These include all input gene lists analyzed in a single GO-Elite run, GO, and local pathway results. Each line is identical to that in the original input file, except in that the first column indicates the filename of the data it was derived from. These are typically the most useful files, since they contain all of the data combined into a single spreadsheet.