This is a project I'm working on for my COMP 312 (Open Source Computing) class.
I’m interested in the health care field. Looking through the data available, I saw that there is a lot of information relating to birth statistics. I would like to look a the infant mortality rate and correlate that with socioeconomic factors, birth weight and access to prenatal care.
I will be looking at:
- Is there a relationship between infant mortality rate and the socioeconomic hardship index?
- Is there a relationship between infant mortality rate and prenatal care?
- Is there a relationship between infant mortality rate and geographic location?
First I downloaded the data from the Chicago Data Portal. Specifically, I downloaded the following csv files:
- Census Data - Selected socioeconomic indicators in Chicago, 2008
- Public Health Statistics- Infant mortality in Chicago, 2005– 2009
- Public Health Statistics - Prenatal care in Chicago, by year, 1999 – 2009
My next step was to parse and load the data into the python analysis file. I did this using python's csv package. The great thing about these csv files is that they are presented in a similar fashion. Basically, each line represents the statistics for each one of the 77 neighborhoods in Chicago. The ordering of the lines is similar in all three files (e.g. line 2 in all three files corresponds to statistics for the Rogers Park Neighborhood, line 3 for West Ridge etc). Because of this I was able to load statistics for the infant mortality, prenatal care and the socioeconomic factors into an array where the indexes aligned--meaning that index 0 in all three arrays referred to Rogers Park, index 1 to West Ridge etc.
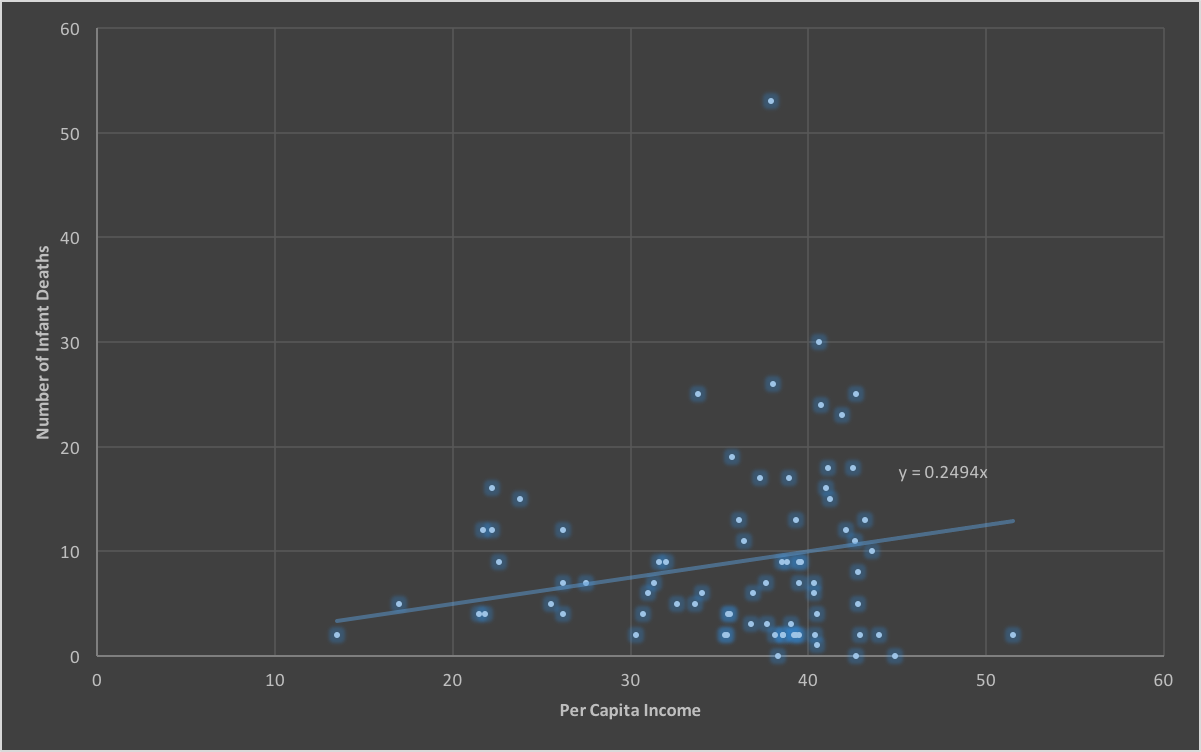
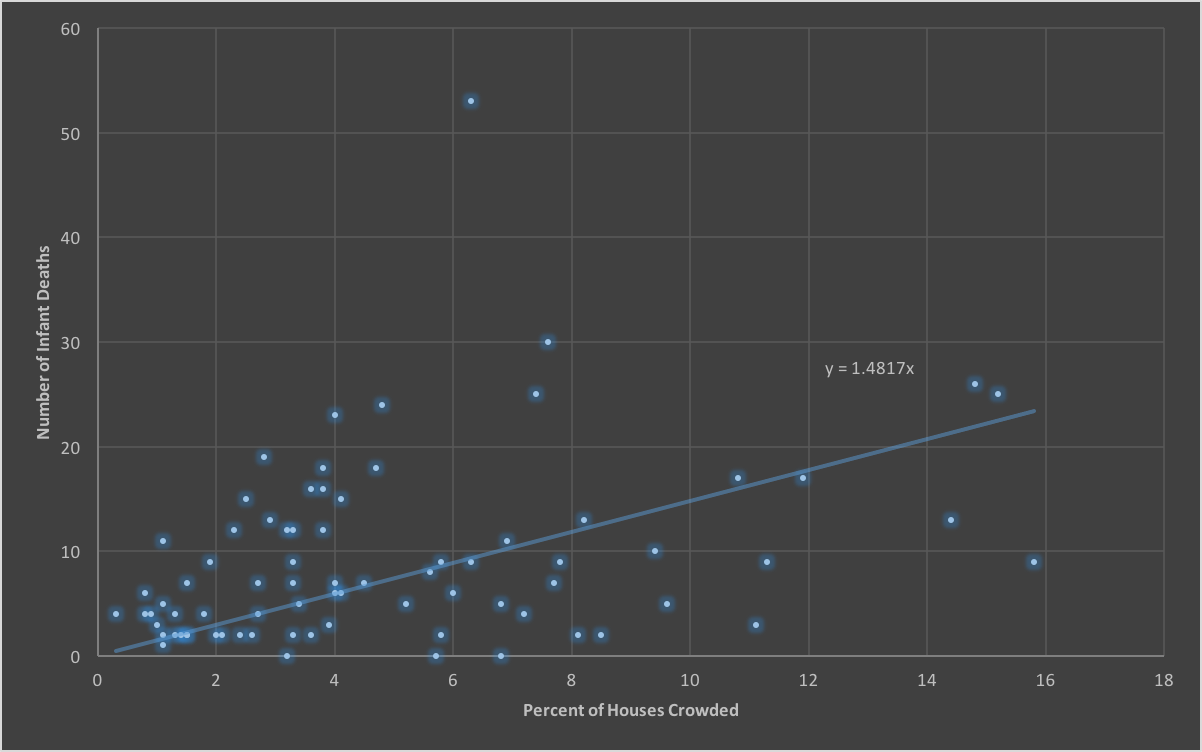
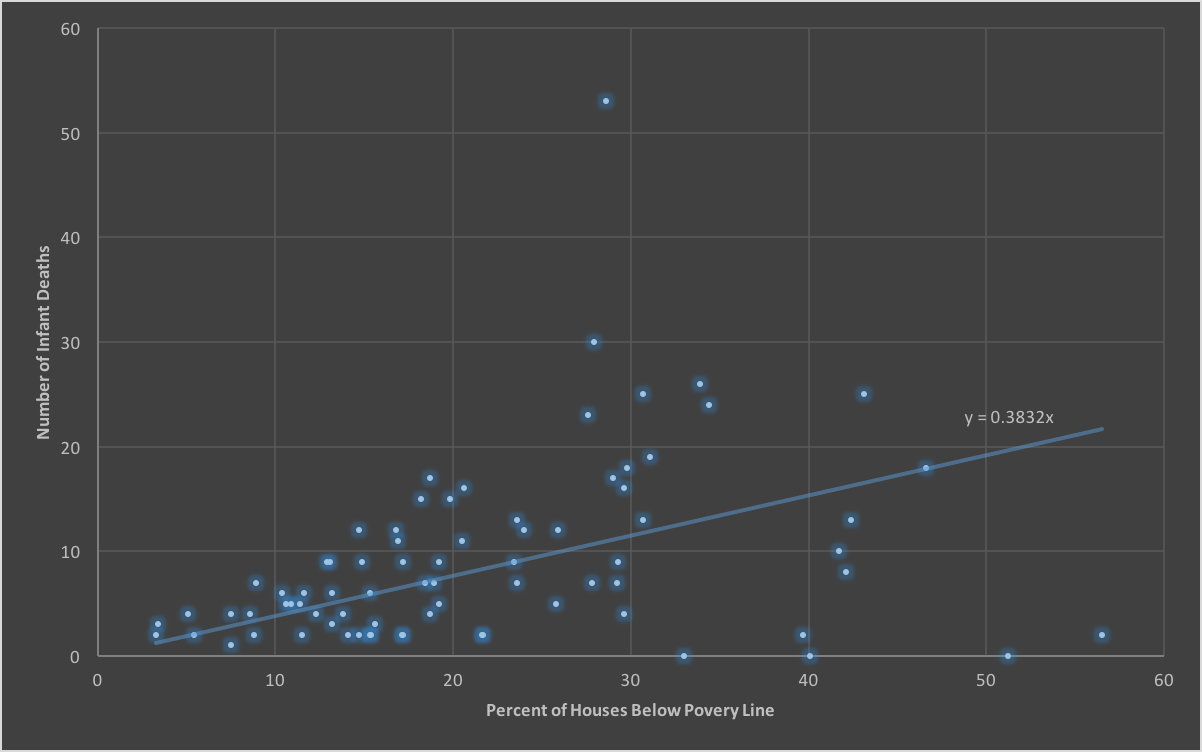
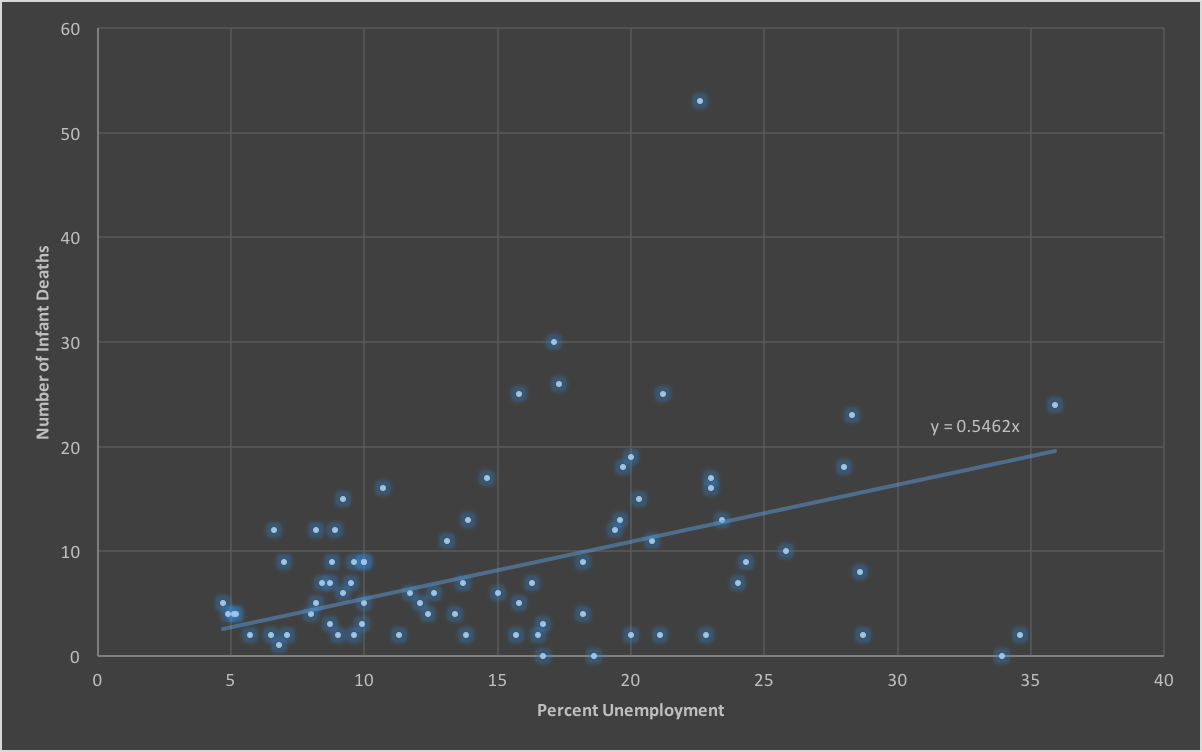
After loading the data, I was easily able to use Scipy's pearsonr method to calculate the correlation between the different factors.
| Variable | Correlation Value | Conclusion |
|---|---|---|
| Per Capita Income | 0.0820489305198l | No Correlation, negligible |
| Percent of Houses Crowded | 0.342126944849 | Slight correlation |
| Percent of Houses Below Poverty | 0.333903734116 | Slight correlation |
| Unemployment Rate | 0.298623726684 | Slight correlation |
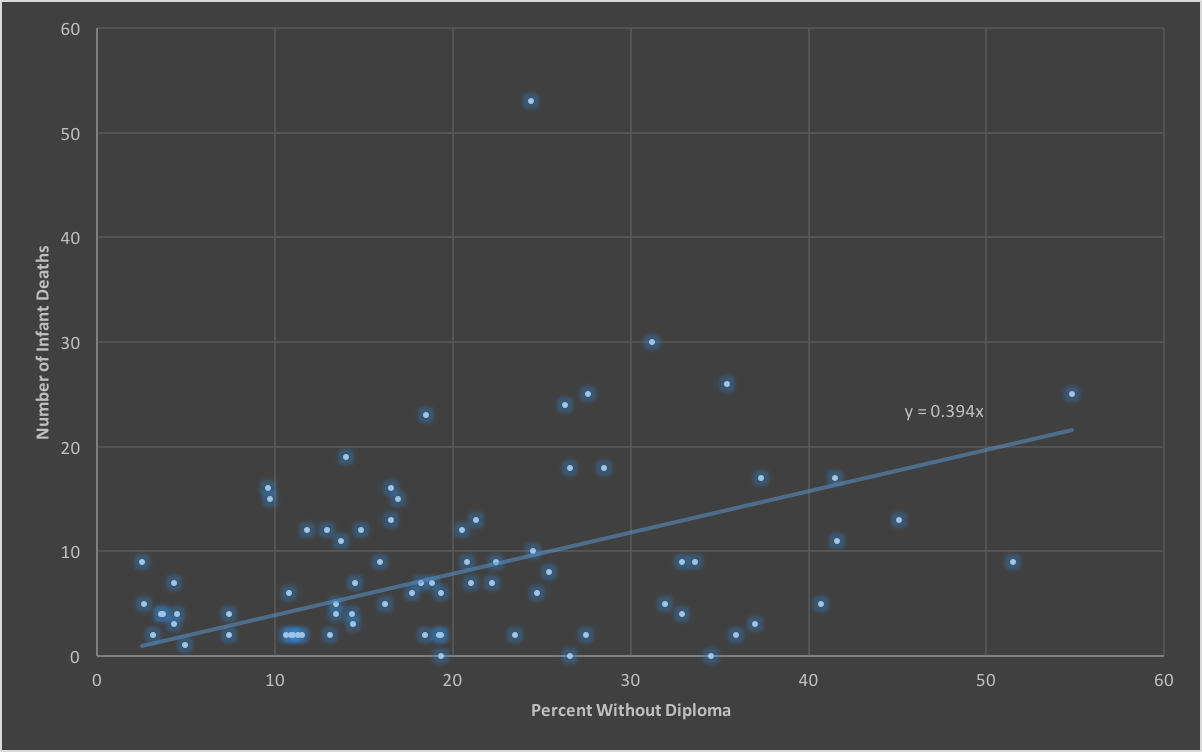
| Percent of Citizens Without a Diploma | 0.311752861574 | Slight correlation |
| Percent of Infants Given Prenatal Care | 0.162955819276 | Very small correlation |
There is a slight correlation between various socioeconomic factors and the number of infant mortalities. However, the error value is big because I was able to use data for only two years (I was limited by the Socioeconomic Indicators which had data from 2008-2012 and by the data in the public health statistic files which provided data only until 2009). In the future a study over a much longer timeframe would prove much more fruitful.
