Tianyi Wang 2020 May
This is a Capstone project for Udacity Data Science Nanodegree. In this project, we have a fictional music streaming company called Sparkify and we will use customers' demographic and event data to predict which users are at high risk to churn. The full dataset is 12GB, covering the length of 2 months. Thus we will handle it with pyspark. The cluster was deployed on AWS through Databricks.
The fictional music streaming app, Sparkify, is similar to Spotify and Pandora. Users stream songs either using free tiers with advertisements placed between the songs or using premium service subscriptions. Users can upgrade, downgrade or cancel their services anytime. On the app, the users can play the songs, thumbs-up or thumbs-down the songs, add the songs to playlist and add friends.
The definition of "being churned": Downgrade the service (Submit Downgrade) or cancel the service. In our dataset, the churn rate is 22.47%.
We did some research and saw that customers who chose to cancel the service didn't have any following activities after the "cancel" actions. So in this project the definition of "being churned" is very straightforward. In some other cases, "being churned" might mean something like not logging in for 3 months.
The full data set has 26,259,199 rows that cover behaviors from 22,278 unique customers for 2 months (61 days).
Since there are many features that can be built from the data. We define these several general aspects:
- Use time: features that are related to the time the customer spent on the website/app.
- Product actions: features that are specific to the product (music streaming app) -- e.g. numbers of unique artist the customer listened to; numbers of songs the customer added to playlist;...
- Membership: features about which tier (free or paid) the customer is in
- Demographic / device features: we will treat these features as static features
We built about 40 features from the event data. The details and explanations of the features can be found in the notebook 01 Data Exploration.
We plotted the distributions of several features:
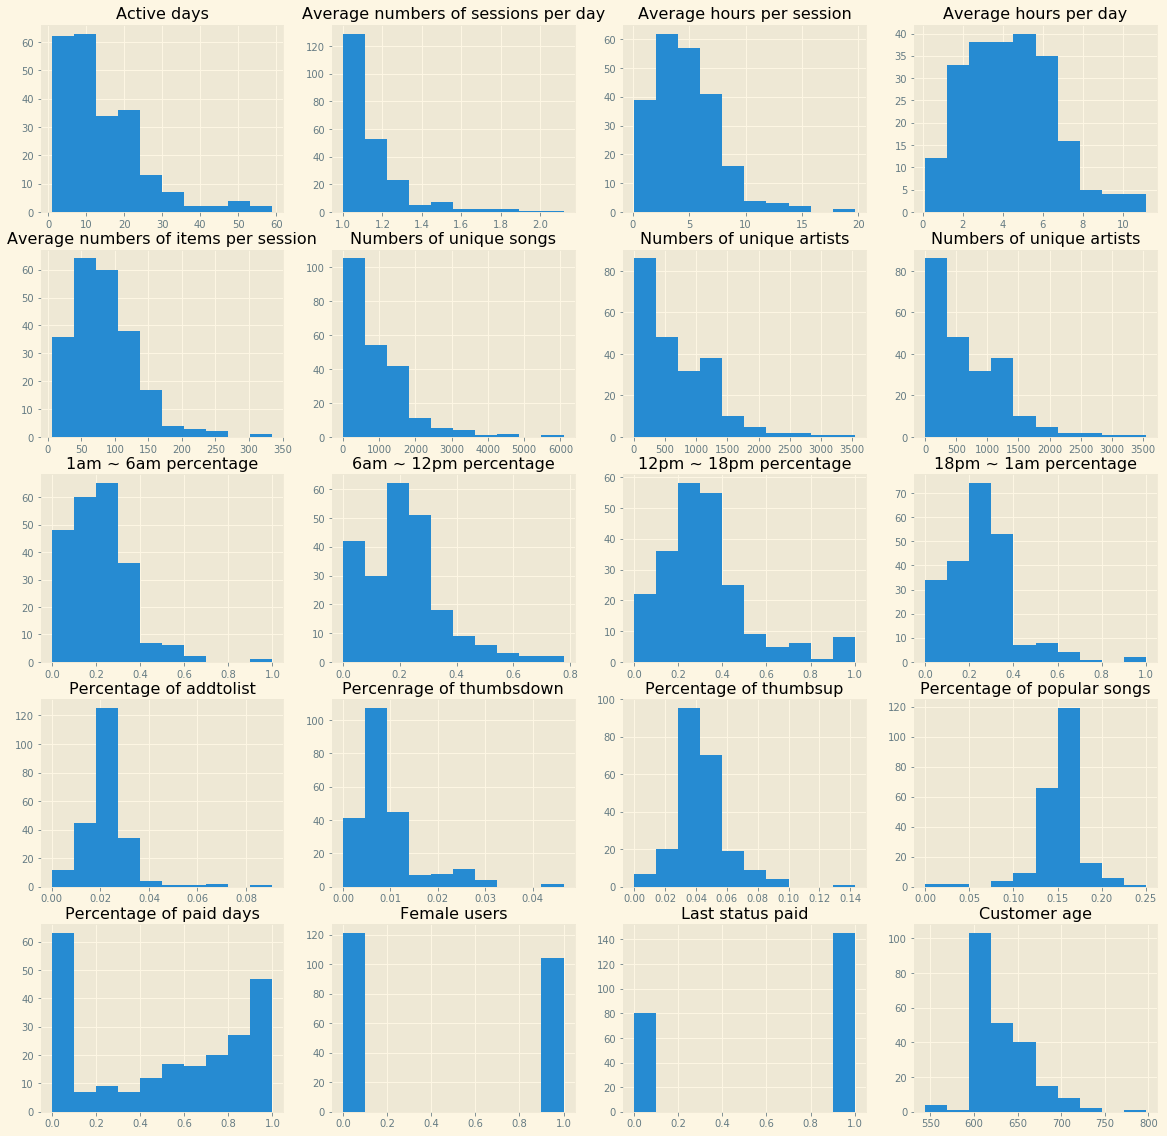
Within the 2 months window, 52.89% of the customers were active for more than 10 days, 58.22% of the customers opened more than 1 seesion per active day, 72.44% of the customers spent more than 3 hours per active day, 13.33% of the customers remained paid status for the whole time period.
We tried 3 classifiers -- Logistic Regression, Random Forest Classifier and Gradient Boosting Classifier. The 3 types of classifiers can all provide ROC scores of more 0.76.
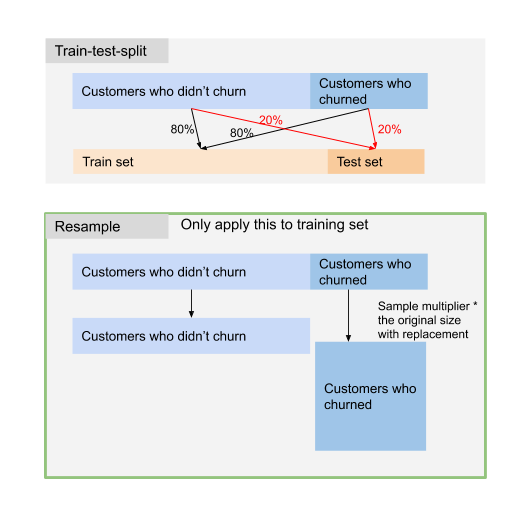
The first model we tried was actually Gradient Boosting Classifier because it usually provides better results than other classifiers. We firstly checked whether it's a good idea to resample the training data since only 22% of the customers churned (not really a sign for imbalanced data, but we would like to see whether resampling helps). In the training data, we kept all of the data with negative labels (not churned) and upsampled the data with positive labels with a multiplier. If the multiplier is 3, we would sample 3 times of the original data (with positive labels). We tried the multipliers 3, 2, 1.5 and 1. For each multiplier we run the modeling pipeline (including training and validation set split) for 3 times to get more robust model evaluation.
The AUC scores for the 4 models are actually pretty close --- they all fall between 0.75 and 0.77 and the average AUC scores are around 0.76. We decided to use the multiplier 3. When tuning the parameters of the Gradient Boosting, we found that the results didn't vary a lot when we use different parameters. The AUC store still maintained between 0.76 and 0.77.
We followed the same modeling tuning procedure in the above section to tune random forest classifier. Interestingly before we tuned the classifier parameters we only got AUC scores between 0.73 and 0.74. After tuning the classifier parameters (increasing max_depth from 5 to 8) the AUC scores reached more than 0.76.
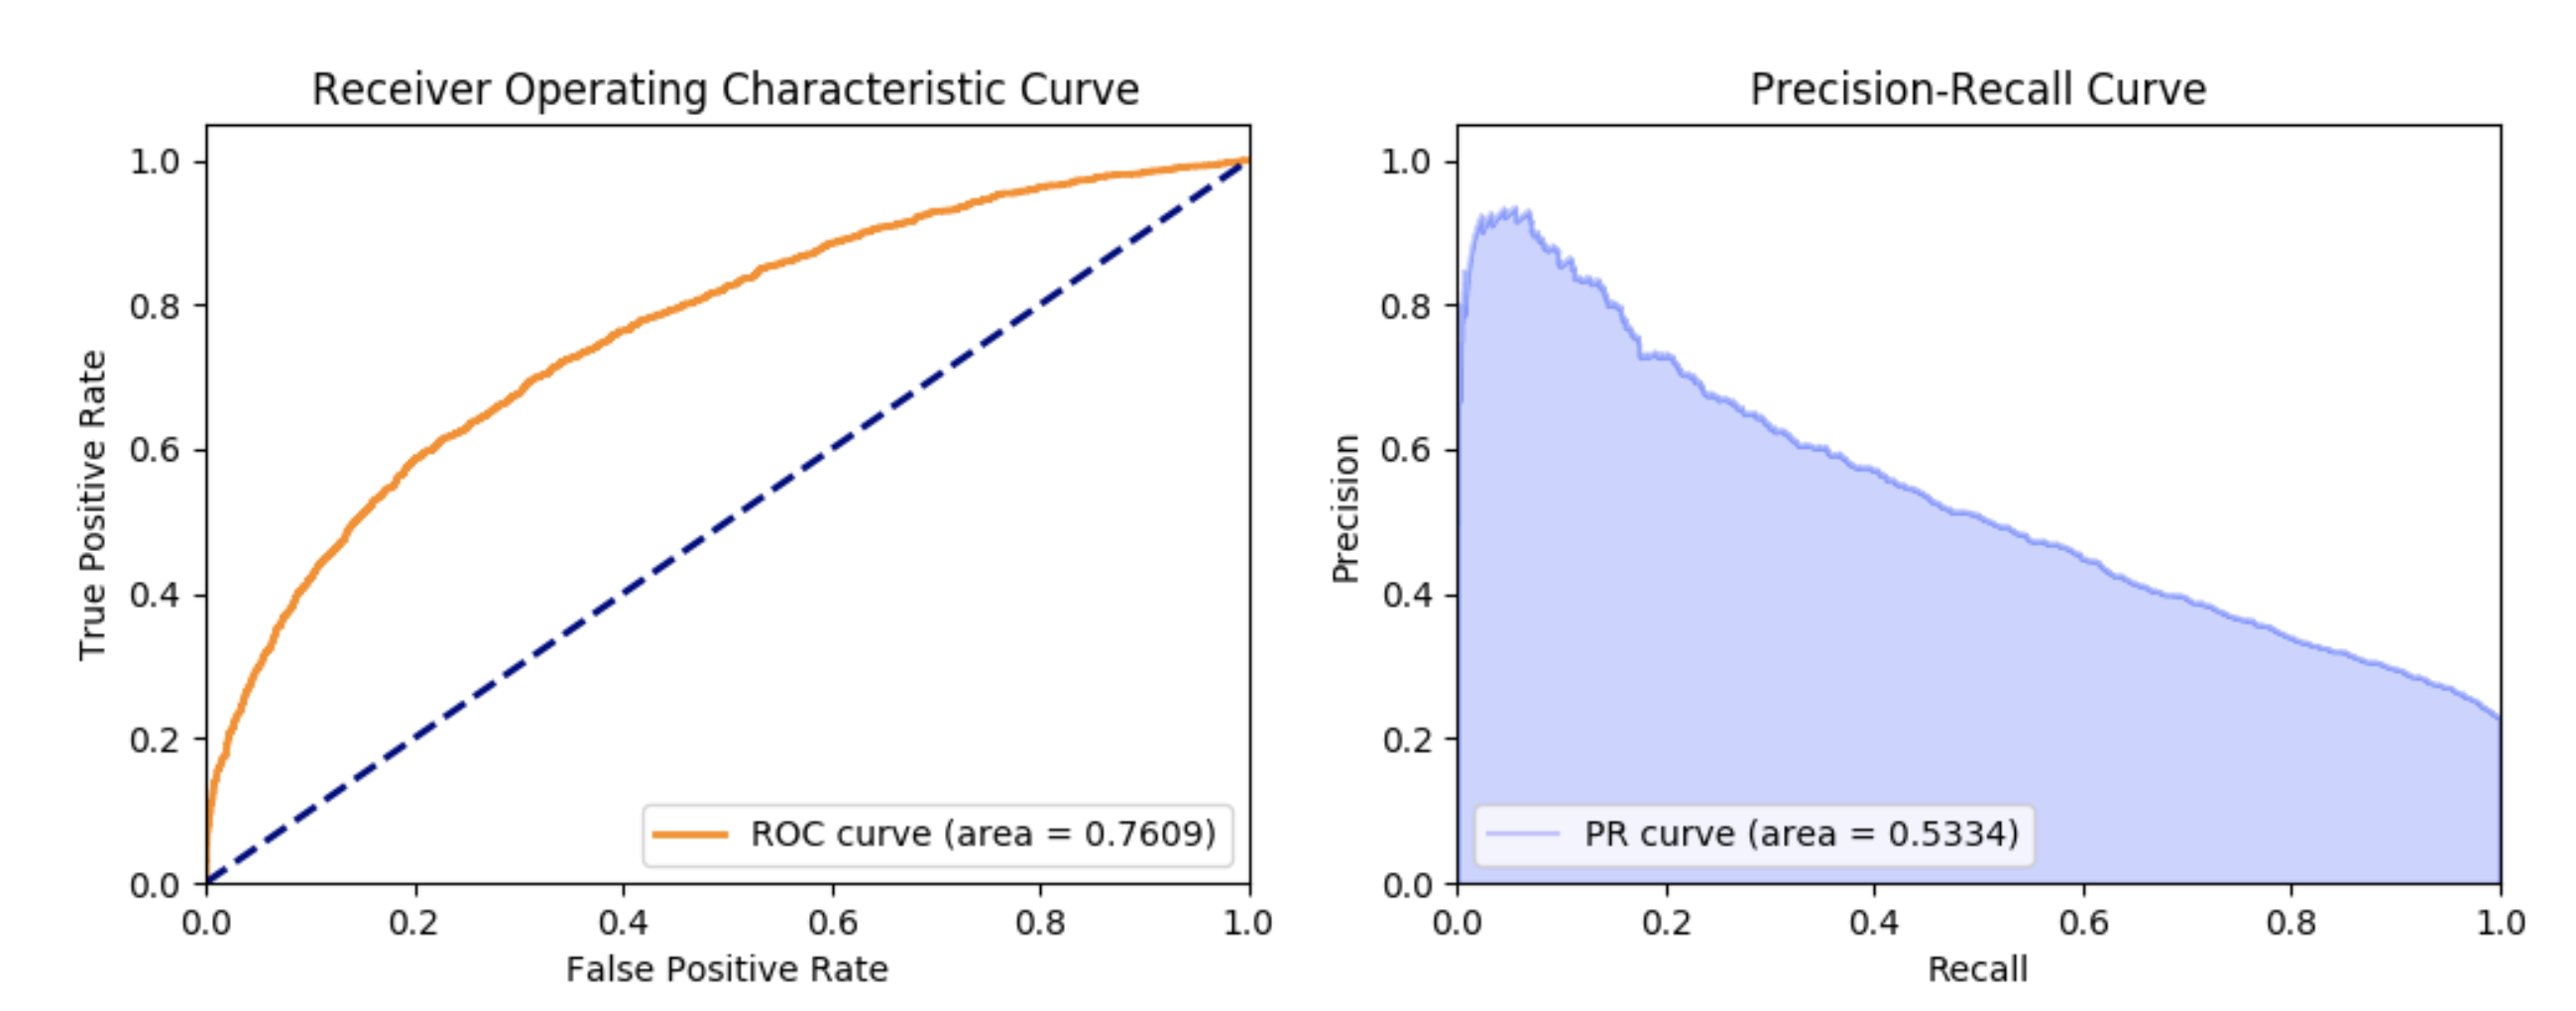
Logistic Regression is actually as effective as Gradient Boosting Classifier. The AUC scores were also between 0.76 and 0.77 when we tried different parameter sets.
For tree based models, the important features are the following:
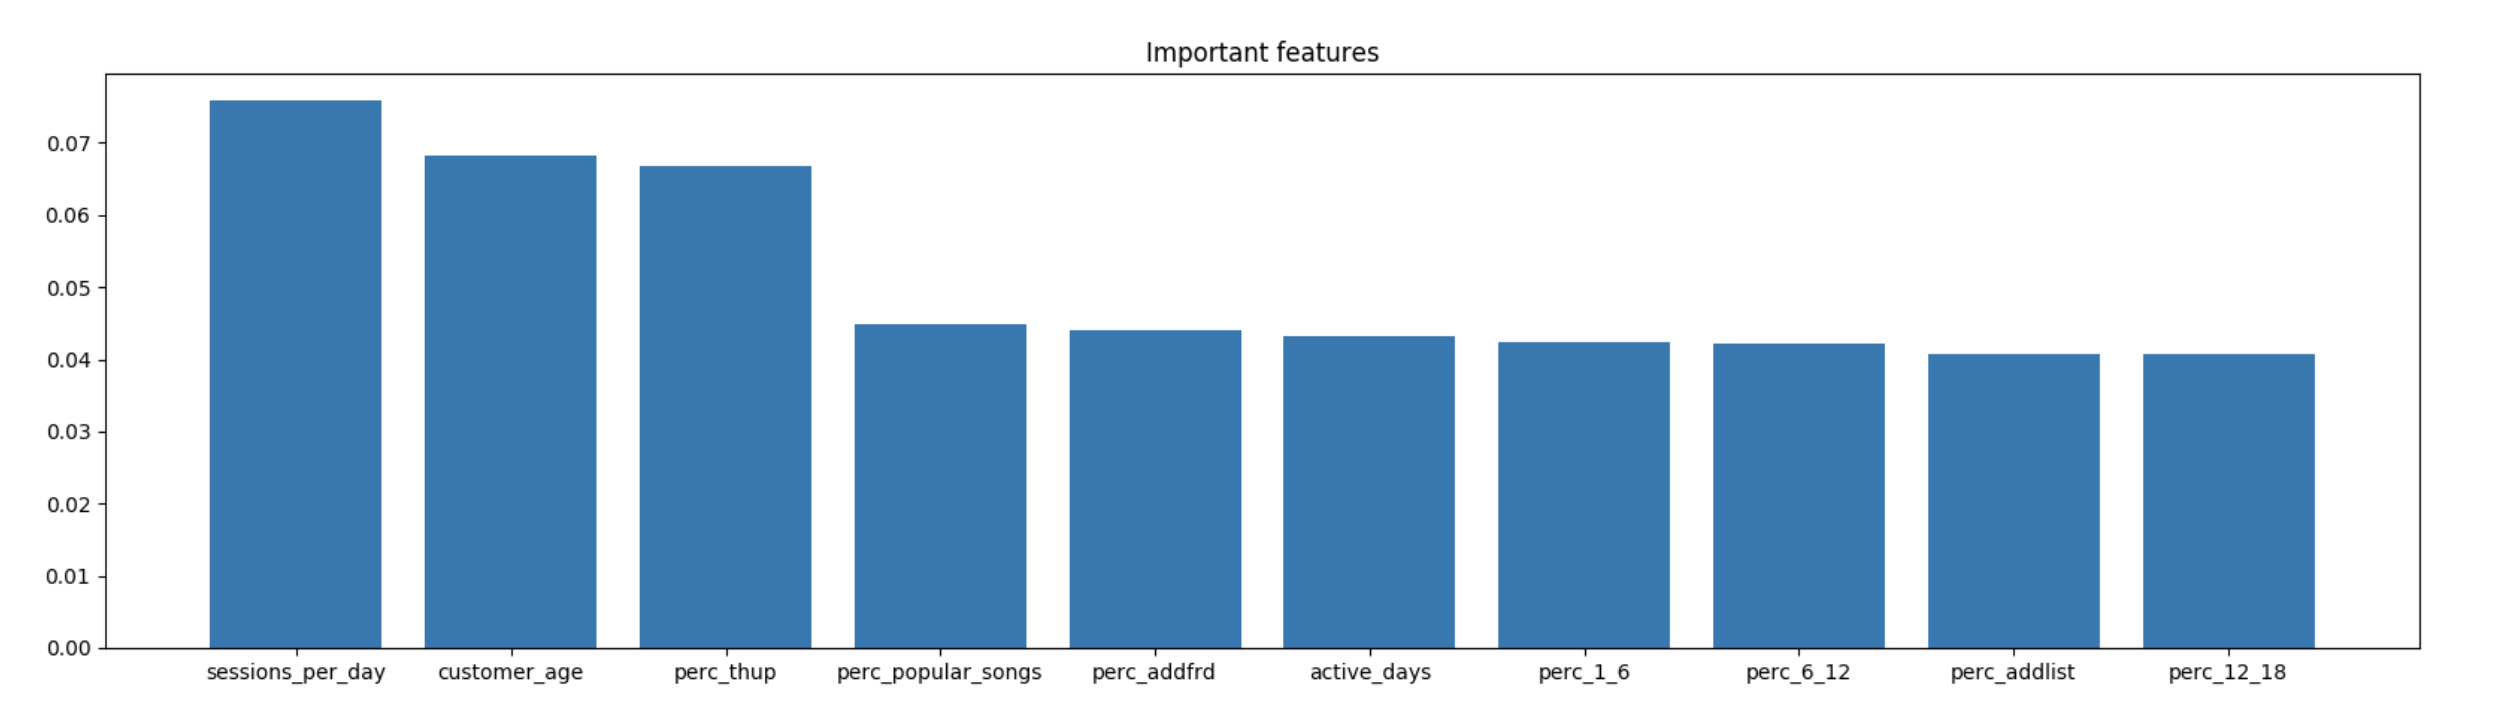
Numbers of sessions per active day, customer lifetime, percentage of thumsbups in all actions are the top 3 important features.
There are 2 utility scripts in this repo:
DataPreparation.py: ETL pipelinemodeling_helper_functions.py: helper functions for modeling process