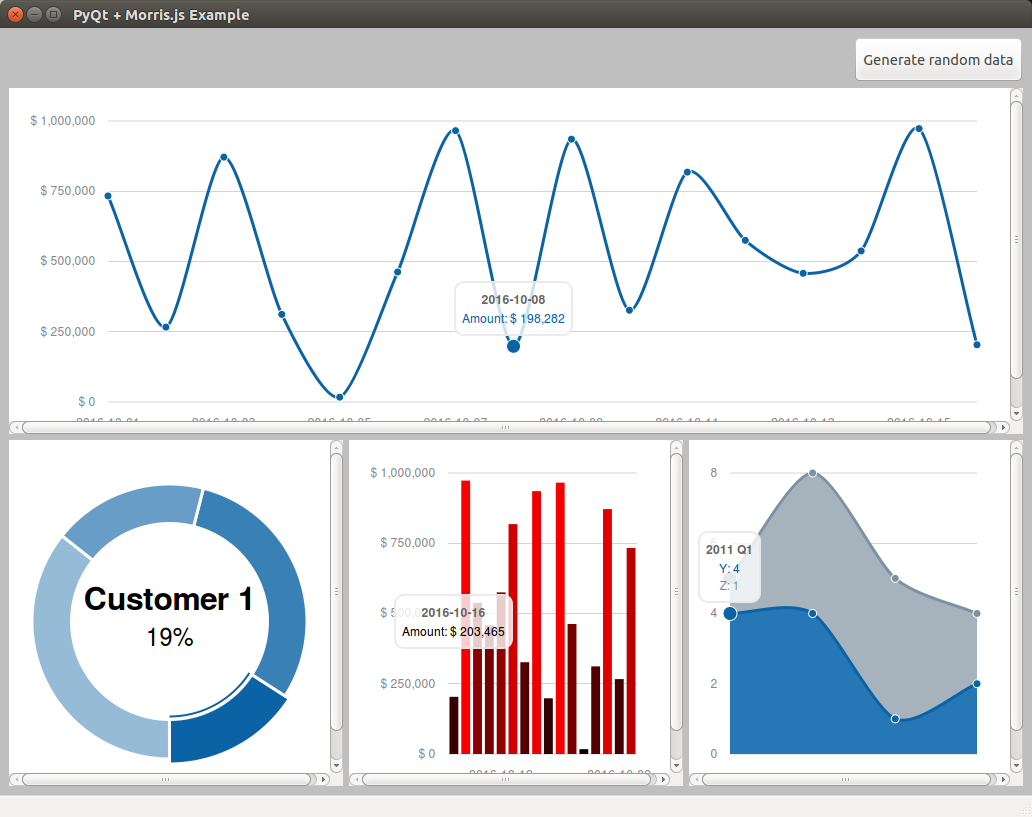
Binding class to use Morris.js charts in a PyQt environment.
- jQuery v2.0.3
- Morris.js v0.5.0
- Raphaël v2.1.2
- PyQt 4.7
Morris(self, widget, chart='Line', data=[], xkey='', ykeys=[], labels=[], raw='', **attrs)
Class constructor
Key 'widget' must be an instance of QWidget
show(self)
Render the chart
updateData(self, data)
Update the data ploted in the chart
Instancing the chart with init data
from morris import Morris


self.chart = Morris(self.widgetChart, 'Line')
self.chart.data = [
    {'label':'2014', 'value':30},
    {'label':'2015', 'value':60},
    {'label':'2016', 'value':10},
]
self.chart.xkey = 'label'
self.chart.ykeys = ['value']
self.chart.labels = ['Amount']
# use 'raw' key to set another keys out of [data, xkey, ykeys, labels] keys
self.chart.raw = 'preUnits: "$ "'
self.chart.show()
Updating the data
self.chart.updateData([
    {'label':'2014', 'value':120},
    {'label':'2015', 'value':150},
    {'label':'2016', 'value':260},
])
MIT