This repository was made as part of a student project for the subject TDT4290 – Customer Driven Project at NTNU. The goal for this part of the project was to predict where person-triggered avalanches are going to happen based on previous avalanche data. We tried to do this using machine learning. Even though the project in the end did not work as expected (see conclusions further down), we hope this repo might be useful if someone were to continue the work at a later point in time.
The dataset is fetched from the norwegian avalanche forecast api. We have also added calendar information by using pythons date api and the holiday api. The occurencies of person-triggered avalanches are determined using the varsom regobs api, which is based on voluntary registrions of avalanche observations/accidents. Here we filter out avalanches based on certain criterias to get information about those avalanches who are person-triggered.
Currently, we are only using data from the last 3 years, because we do not have avalanche forecast information for earlier times.
More info about the data and fetching can be found in the data-secton, and more info about how the data is processed is found in the file Feature_analysis.xlsx.
There are two ways to run this project. You can either use jupyter notebook (instructions below) or run the python files in the src-folder. We suppose that using the jupyter notebook version is the easiest.
For running the jupyter notebook, you first need to install jupyter by writing (in ther terminal):
pip install jupyter
After doing this, you can run jupyter notebook by running:
jupyter notebook
If you want to have full control and run each individual python file, you can follow the instructions below.
To be able to run the prosject, you need to install the required packages by running pip install -r requirements.txt.
All the python scripts are located in the src-folder. Since the scripts are dependent of each other. They should be run in the order described below.
IMPORTANT NOTE: The script fetcher.py will not work without access to our database. If you download this repo without having access to the database, the script will not work. Therefore, we have already run this script for you and saved the output data in the file data/dataset.csv.
Input:
- Avalanche forecast API
- External avalanche database (currently hosted by NVE)
Output: data/dataset.csv
The fetcher.py script gathers data from the forecast API and our external before merging them into a single dataframe.
Input: data/dataset.csv
Output: data/processed_data.csv
This script reduces and cleans the features before normalizing the data. Currently, we do normalization such that all the output values are between 0 and 1.
Input: data/processed_data.csv
Output: data/balanced_dataset.csv
The processed_data is not balanced, meaning that there are more data where there are no avalanches than data where there are avalanches (more 0 values for "avalanche" than 1 values). The balance_dataset script reduces the number of rows without an avalanche such that it becomes the same number of rows with and wothout an avalanche.
Input: data/balanced_dataset.csv
Output: AI-model saved in resources/model.tf
The script create_model.py creates the AI-model and trains it on the balanced dataset.
Input:
- AI-model from
resources/keras_model - Test data from
resources/input_mock_data.csv
Output: Plots of accuracy of the model
The script evaluates the model with test data, and provides plots for distribution of the accuracy.
Input: data/dataset.csv
Output: .png files in the plots folder
The script creates plots for the features in the original dataset. Note: The script plots data from the original dataset dataset.csv and not the processed versions.
Input:
- AI-model from
resources/keras_model - Forecast regions from
resources/forecast_area.json - Input data from
resources/input_mock_data.csv
Output: Map of dangerlevel for each region. The map is saved in plots folder.
The script create_map.py plots the output values for a model on the map. The output values are also written to the console.
the dangerlevel of an avalanche for each region based on the input data with the AI model.
The file Feature_analysis.xlsx contains the choices done regarding which features from the file Data/dataset.csv we decided to use for our model. The file also describes the changes that were done to some of the data during preprocessing.
The data-folder contains the datasets from runnin the scripts in src folder.
Generated by script src/fetcher.py.
NOTE: It is not possible to fetch the data without access to an external avalanche database (currently hosted by NVE). The dataset is already downloaded and is up-to-date pr 27/10/2020.
The resources folder contains additional files which are needed for the project
JSON file containing information to create a map for visualization.
This file contains the input for the AI-modell to predict avalanches for 1st of March 2020.
This folder contains the plots generated in src/create_plots.py and map from src/create_map.py
The results were not as good as we hoped for, and the model gives different results each time we create it. This is seen very clearly on the map plots (showing the results of the model on mock data relative to each region). Create the model again and create a new map plot and you will see the plot changing dramatically, as the model does not seem to find a general global optimum.
We believe some of the reasons why the model does not wok as good as we hoped are:
Machine learning in general is very data heavy, and currently we are only using data for the last three seasons. For training we have 518 examples of dates and regions where there are avalanches and 518 examples of dates and regions where there are no avalanches.
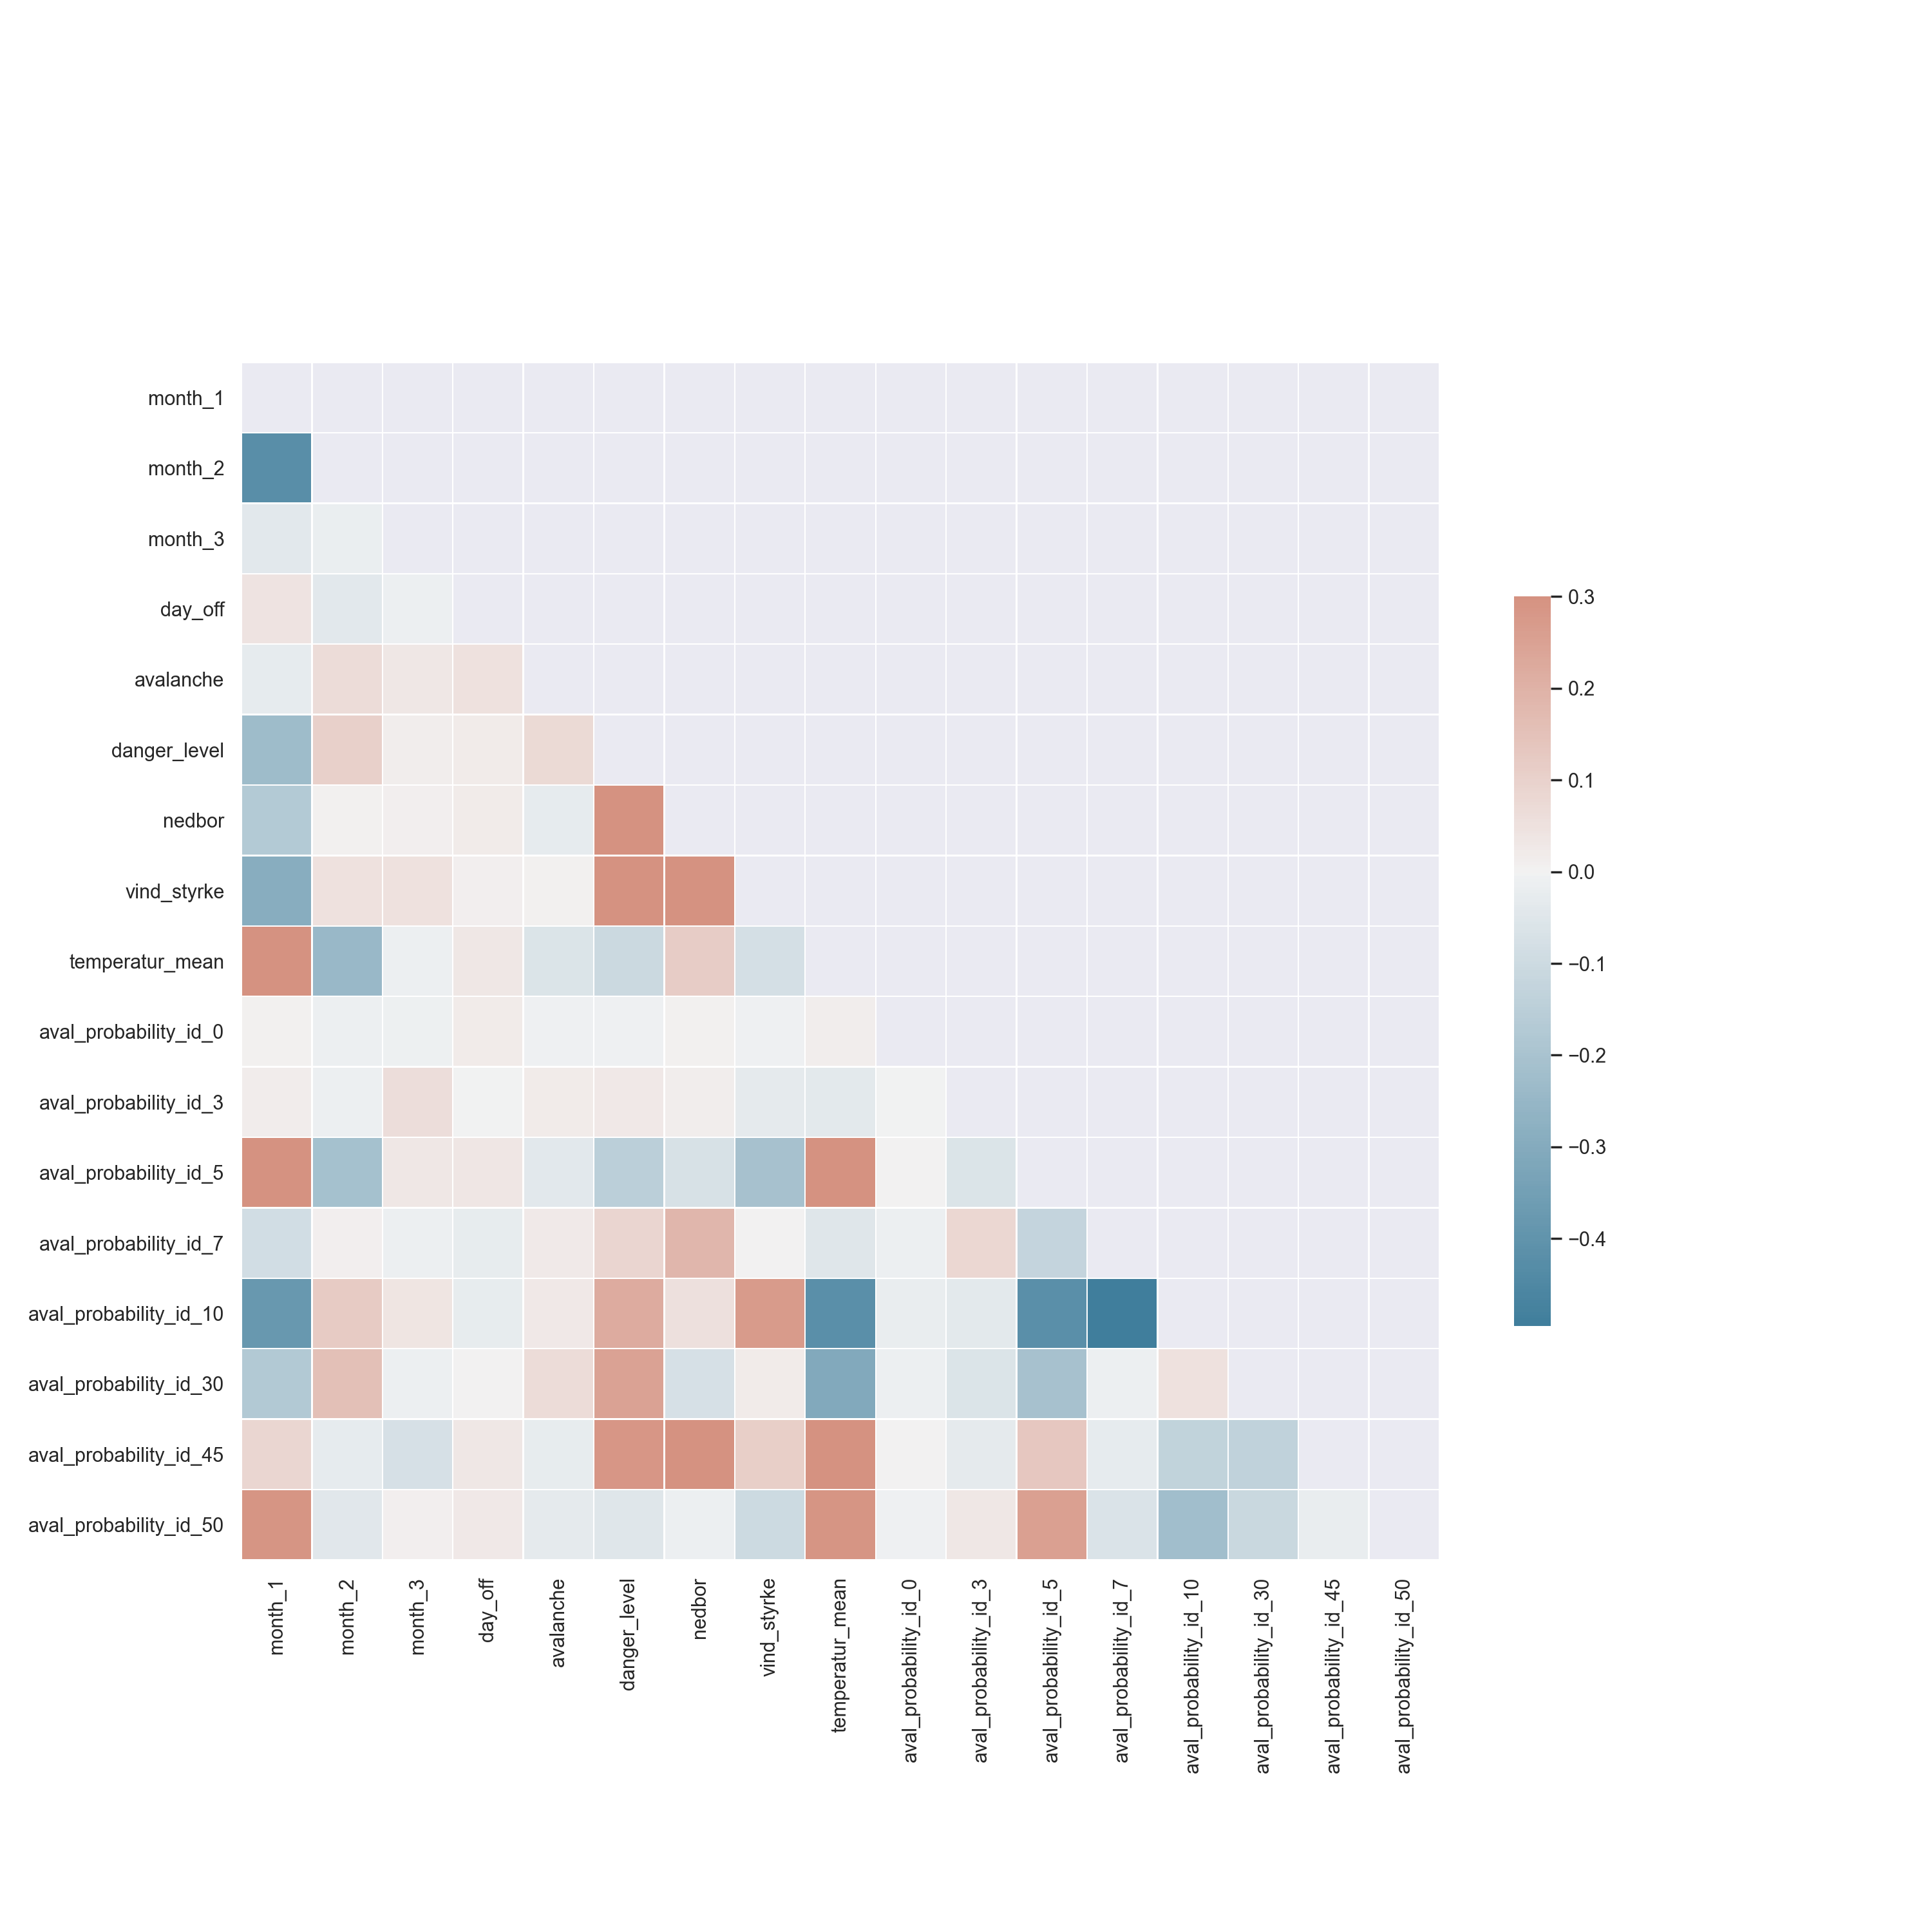
The domain of avalanche prediction is dificult for machine learning as there is in general no clear correlations for when an avalanche will occur. The same weather, date and avalanche prediction data can be seen for many days while only a very few of those days will have an avalanche. It is therefore very dificult for the method to seperate our training examples into places where avalanches will happen and not. A correlation plot is included in the jupyter notebook, where we can see that very few variables corralate with our label-variable "avalanche". Again, since the correlation are not that evident, it might be good to have more data. The correlation plot is also shown below:
The method we have used is mostly used for classifying examples into binary categories. It seems that this method doesn't work very well with avalanches since the fact that an avalanche has happened is a combination of bad weather and snow conditions, how many people are present in the mountains and how cautious these people are. If you ask experts whether or not an avalanche will happen tomorrow, they will not have an exact answer, since there are so many uncertain variables involved. (they might believe there are higher or lower risk for avalanches, but they cannot be certain). This means there are no "ground truth" for our classification-data (labels).
This is very different from other classification problems where for example want to classify an image as either being "cat" or "dog". In that case it would always be a ground truth being 100% correct.
We were asked to make a confusion matrix for how good the algorithm performs by checking where we "were right" and where we "were wrong" in our predictions. In our opinion this does not sense, because there are no clear right or wrong (ground-truth). If we predict a 51 % chance of a person-triggered avalanche should happen tomorrow and it does, should this be considered a "right guess"? and should 49% be considered a "wrong guess"?
We were also discussing to categorize our output data into multiple categories, but this doesn't make a lot of sense as the model gives somewhat different value ranges from build to build. (It does not converge to the same minimum each time)
We also made the choice to balance our dataset so that the model would not tend towards predicting "not avalanche", as about 95 % of our training data says "not avalanche". This made the algorithm have a lot of guesses around 50%, which is in most cases far far too high.
Since our experiments did not go so well, we have some suggestions regarding taking the project further. Everyone is free to fork this project and try out working with the dataset themselves.
As there are no "ground truth" in our data, is it probably better to use some kind of statistical method taking uncertainties futher into account.
In 3 years we will have doubled the amount of data, so maybe it will be possible to get better predictions then?
It was for example discussed to find the number of regobs-observations for the past 3 days before each person-triggered avalanche an use this as an indicator to where the next avalanches are going to happen.