Skip to content

portfors-lab/SparkleAnalysis

Folders and files

NameName
Last commit message
Last commit date

Latest commit


History

60 Commits


Repository files navigation

SparkleAnalysis

Extra analysis tools for viewing Sparkle data
alt tag

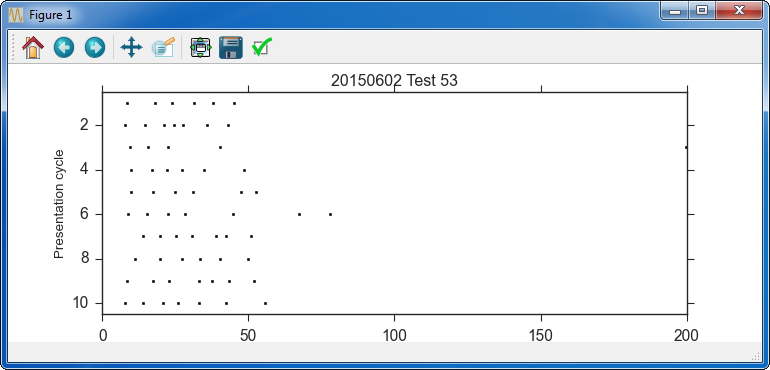
Raster:

alt tag
Creates a raster plot based on the test number, trace number and threshold value.
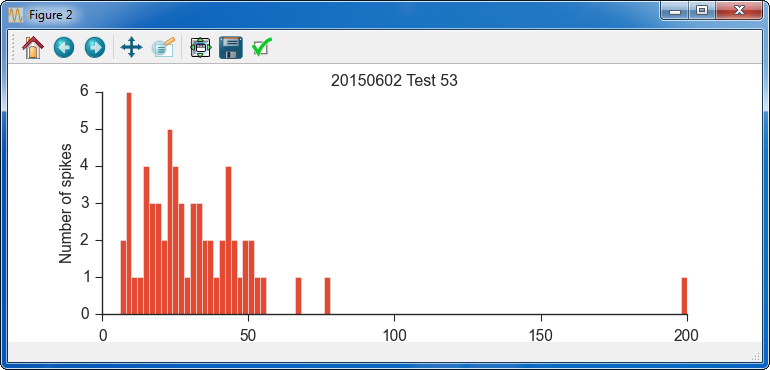
Histogram:

alt tag
Creates a histogram based on the test number, trace number and threshold value.
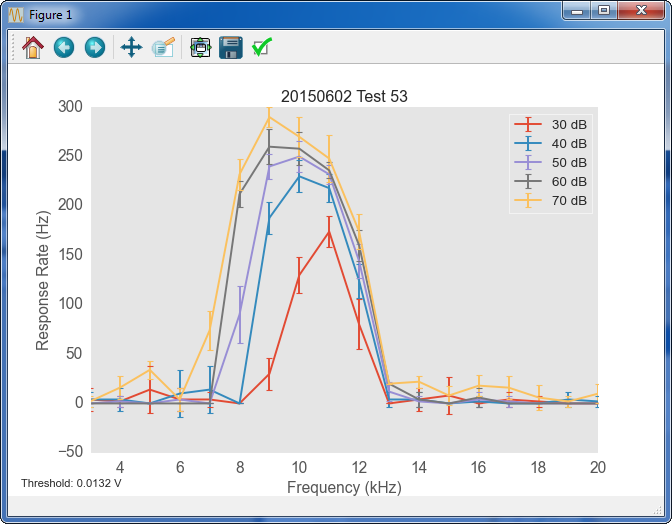
Tuning Curve 1:

alt tag
Creates a tuning curve based on the test number and threshold.
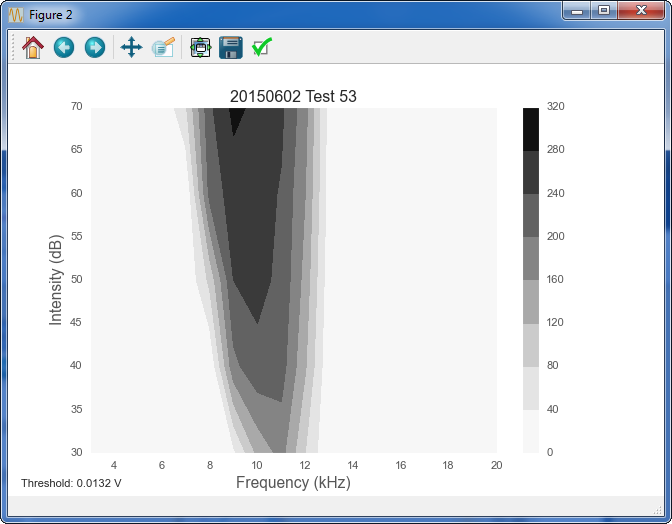
Tuning Curve 2:

alt tag
Creates a tuning curve based on the test number and threshold.
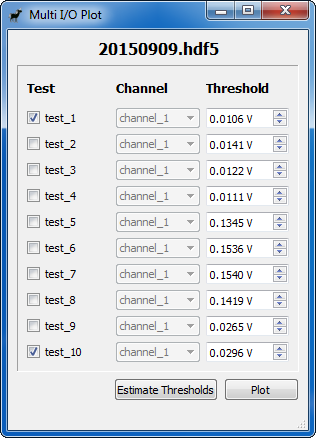
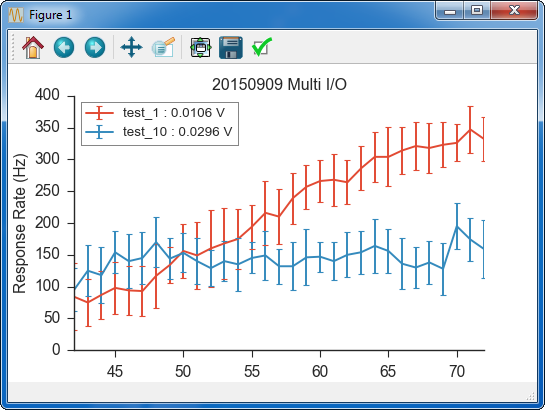
Multi I/O:

alt tag alt tag
Opens a window for creating I/O plots. Select the desired tests and set the threshold to plot.

About

Extra analysis tools for viewing Sparkle data

Resources

Stars

Watchers

Forks

Releases

No releases published

Packages

No packages published