Application for analizing statistics of FTL ACS/UI applications provided in CSV format.
You just need to: - have your CSV in correct format (see usage section and samples folder) - define your settings in settings.py
``` git clone git@github.com:swifty94/DataAnalysis.git ```
``` pip3 install -r dependencies.txt ```
- Header of each ACS serer CSV report for input MUST be as below:
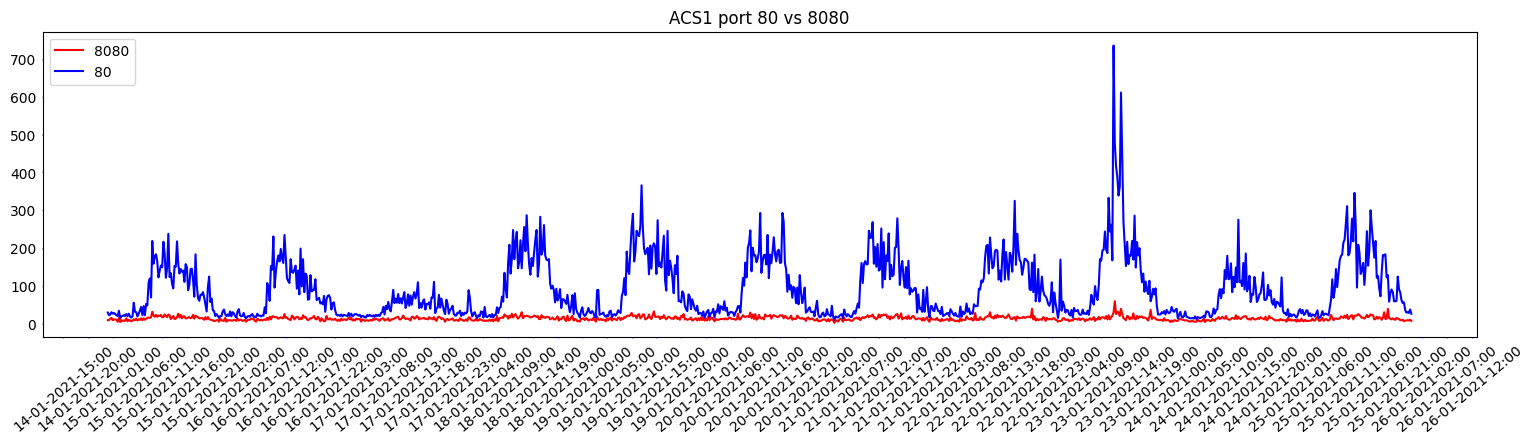
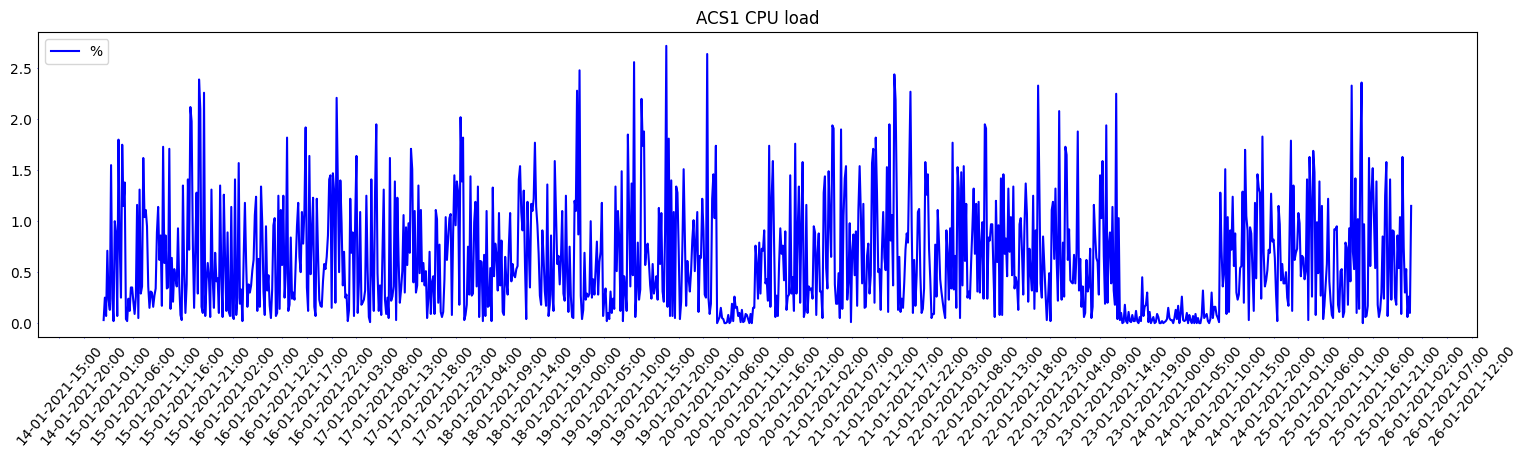
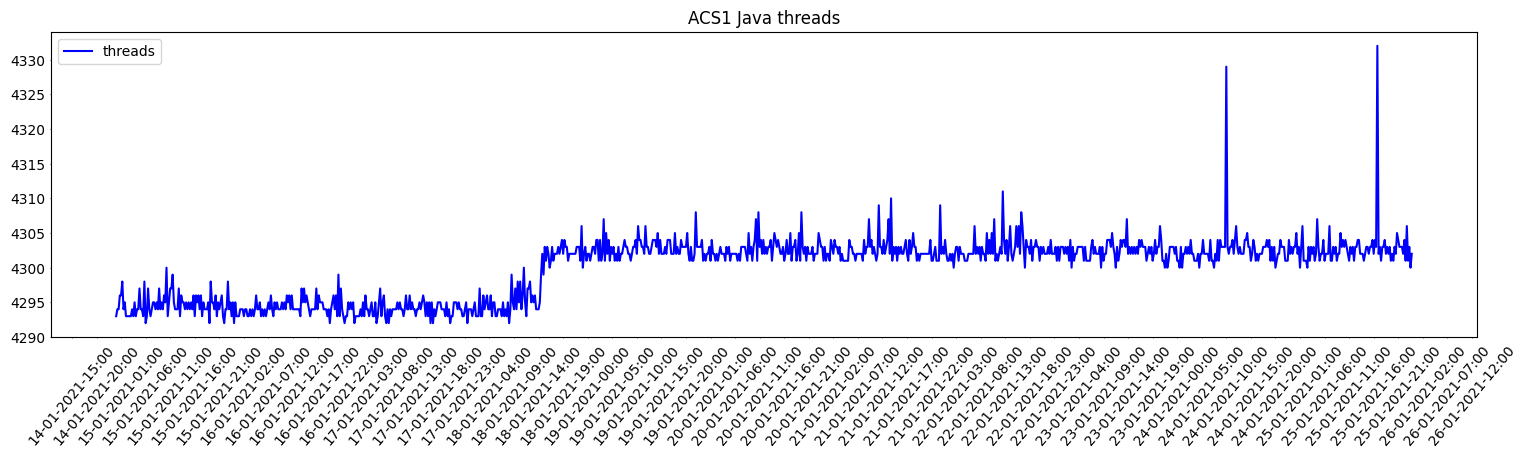
timestampt,javathreads,oracle_1521,acs_port_8080,acs_port_8181,acs_port_8443,acs_port_80,acs_port_443,acs_port_8182,total_ram,used_ram,free_ram,java_ram,cpu_load
- Header of each UI server CSV report for input MUST be as below:
timestampt,total_ram,free_ram,used_ram,cpu_total,cpu_loadavg,acs_8080,acs_8181,acs_8443,mysql,oracle,iis_ram,iis_cpu
-
Timestampt in the all CSVs MUST be in following standard - "DD-MM-YYYY-HH:MM:SS"
-
Please check content of 'samples' folder to see the input CSV reports exaples
-
Place your CSV reports to root directory of the application
-
Check settings.py and define your specific details there, such as name of the CSV files (see respective section of settings.py) or SMTP.
-
Run:
On Linux
user@host:~$ python3 report.py &
On Windows
C:\Users\Administrator\DataAnalizator\> pythonw report.py
- Follow the log file (FTDataAnalysis.log) or if SMTP notification is defined and enabled - relax.