The smoothfdr package provides an empirical-Bayes method for exploiting spatial structure in large multiple-testing problems. FDR smoothing automatically finds spatially localized regions of significant test statistics. It then relaxes the threshold of statistical significance within these regions, and tightens it elsewhere, in a manner that controls the overall false-discovery rate at a given level. This results in increased power and cleaner spatial separation of signals from noise. It tends to detect patterns that are much more biologically plausible than those detected by existing FDR-controlling methods.
For a detailed description of how FDR smoothing works, see the paper on arXiv.
To install the Python version:
pip install smoothfdr
You can then run the tool directly from the terminal by typing the smoothfdr command. If you want to integrate it into your code, you can simply import smoothfdr.
The R source and package will be on CRAN and available publicly soon.
There are lots of parameters that you can play with if you so choose, but one of the biggest benefit of FDR smoothing is that you don't have to worry about it in most cases.
To run a simple example, we can use the example data in example/data.csv. This is a simple 128x128 test dataset with two plateaus of increased prior probability of signal. Running FDR smoothing on this is simple:
import numpy as np
from smoothfdr.easy import smooth_fdr

data = np.loadtxt('example/data.csv', delimiter=',')
fdr_level = 0.05

# Runs the FDR smoothing algorithm with the default settings
# and using a 2d grid edge set
# Note that verbose is a level not a boolean, so you can
# set verbose=0 for silent, 1 for high-level output, 2+ for more details
results = smooth_fdr(data, fdr_level, verbose=5, missing_val=0)
By default, the smooth_fdr function will assume you are working with a multidimensional grid that has the same shape as the data array. If your points are connected differently, you need to make data a one-dimensional vector and pass in list of (x1, x2) pairs via the edges parameter. Also, if you are dealing with a grid, but you have some missing data (e.g., an fMRI scan) then you simply pass the value you use to indicate a missing data point to missing_val.
Once you have run the algorithm, you can use the returned dictionary to analyze the results.
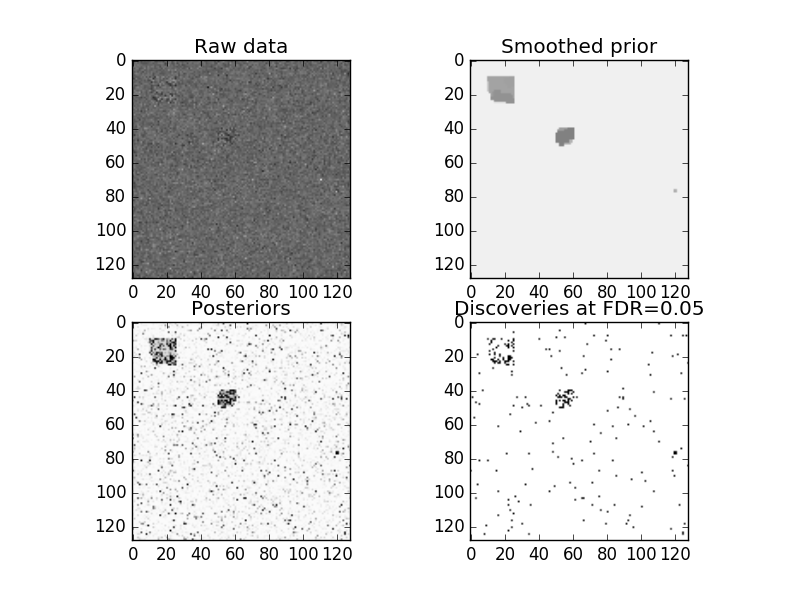
import matplotlib.pylab as plt
fig, ax = plt.subplots(2,2)
ax[0,0].imshow(data, cmap='gray_r')
ax[0,0].set_title('Raw data')

ax[0,1].imshow(results['priors'], cmap='gray_r', vmin=0, vmax=1)
ax[0,1].set_title('Smoothed prior')

ax[1,0].imshow(results['posteriors'], cmap='gray_r', vmin=0, vmax=1)
ax[1,0].set_title('Posteriors')

ax[1,1].imshow(results['discoveries'], cmap='gray_r', vmin=0, vmax=1)
ax[1,1].set_title('Discoveries at FDR={0}'.format(fdr_level))
plt.savefig('results.png')
You can also look deeper into the results object for all the detailed solution path diagnostic information, if you're curious.
False Discovery Rate Smoothing. W. Tansey, O. Koyejo, R. A. Poldrack, and J. G. Scott. arXiv:1411.6144, November 2016 (Version 1 in November 2014).