A python class to easily draw, analyse and animate 3D objects with VTK and numpy.
After installing VTK (e.g. with
conda install -c conda-forge vtk
or sudo apt install vtk7
or pip install vtk), simply type:
pip install --upgrade vtkplotterComplete module documentation can be found here.
From within your python script, load a simple 3DS file and display it:
from vtkplotter import Plotter

vp = Plotter()                      # declare an instance of the class
vp.show('data/shapes/flamingo.3ds') # press *Esc* to close and exit or *q* to continue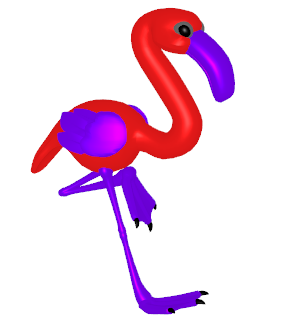
Load meshes of various formats with different options:
vp = Plotter(shape=(3,3), sharecam=False)
vp.show('data/beethoven.ply',      at=0, c=0, ruler=1, axes=0)
vp.show('data/cow.g',              at=1, c=1, wire=1)
vp.show('data/limb.pcd',           at=2, c=2) # point cloud format (pcl)
vp.show('data/shapes/spider.ply',  at=3, c=3)
vp.show('data/shuttle.obj',        at=4, c=4)
vp.show('data/shapes/magnolia.vtk',at=5, c=5)
vp.show('data/shapes/man.vtk',     at=6, c=6, axes=1)
vp.show('data/teapot.xyz',         at=7, c=7, axes=2)
vp.show('data/pulley.vtu',         at=8, c=8, axes=3)
vp.show(interactive=1)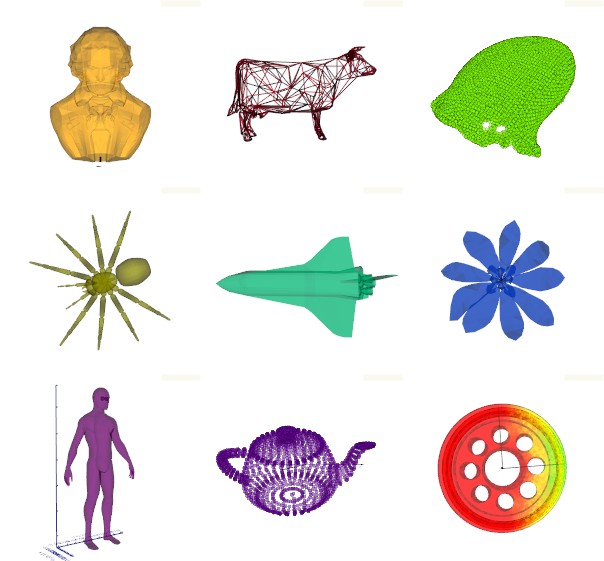
Draw a bunch of basic geometric objects on separate parts of the rendering window:
from vtkplotter.shapes import arrow, line, point, text, sphere, cube
vp = Plotter(N=6, sharecam=False)  # subdivide window in 6 independent parts
vp.show(arrow([0,0,0], [1,1,1]),   at=0, legend='an arrow')
vp.show(line( [0,0,0], [1,1,1]),   at=1, legend='a line')
vp.show(point([1,2,3], r=20),      at=2, legend='a point')
vp.show(text('Hello', bc=(1,0,0)), at=3)
vp.show(sphere(),                  at=4)
vp.show(cube(),                    at=5, legend='a cube')
vp.show(interactive=1)
If you need to do more complicated things (define widgets.. etc), you still have full access
to all standard VTK native objects
(e.g. interactors and renderers through vp.interactor, vp.renderer, vtkActor... etc).
vtkplotter meshfile.vtk  # on Windows try 'python vtkplotter'
# other valid formats: [vtu,vts,vtp, ply,obj,stl,xml,neutral,gmsh,pcd,xyz,txt,byu, tif,slc, png,jpg]
to visualize multiple files or files time-sequences try -n or -s options.
Voxel-data (slc, tiff stack) files can also be visualized with options -g and --slicer,
e.g.:
vtkplotter -g -c blue examples/data/embryo.slc  # (3D scan of a mouse embryo)
vtkplotter --slicer examples/data/embryo.slc 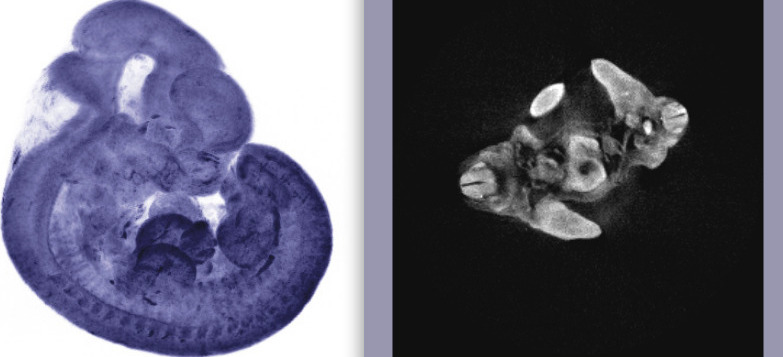
usage: vtkplotter files [-h] [-a] [-w] [-p] [-l] [-c] [-k] [-n] [-x] [-f] [-z] [-i] [-b] [-q] [-s]

positional arguments:
  files                 Input filename(s)

optional arguments:
  -h, --help            show this help message and exit
  -a , --alpha          alpha value [0-1]
  -w, --wireframe       use wireframe representation
  -p , --point-size     specify point size
  -l, --legend-off      do not show legends
  -c , --color          mesh color [integer or color name]
  -k, --show-scalars    use scalars as colors
  -x , --axes-type      specify axes type [0-3]
  -f, --full-screen     full screen mode
  -z , --zoom           zooming factor
  -i, --no-camera-share  do not share camera in renderers
  -b , --background     background color [integer or color name]
  -q, --quiet           quiet mode, less verbose
  -n, --sequence-mode   show each file in a separate renderer
  -s, --scrolling-mode  Scrolling Mode: use arrows to scroll files
  -g, --ray-cast-mode   GPU Ray-casting Mode for SLC/TIFF files
  -gz , --z-spacing     Volume z-spacing factor [1]
  -gy , --y-spacing     Volume y-spacing factor [1]
  --slicer              Slicer Mode for SLC/TIFF files
A get-started tutorial script is available for download:
git clone https://github.com/marcomusy/vtkplotter.git
cd vtkplotter/examples
python tutorial.py  # on mac OSX try 'pythonw' instead
Many more examples can be found in directories: examples/basic, examples/advanced
and examples/volumetric.
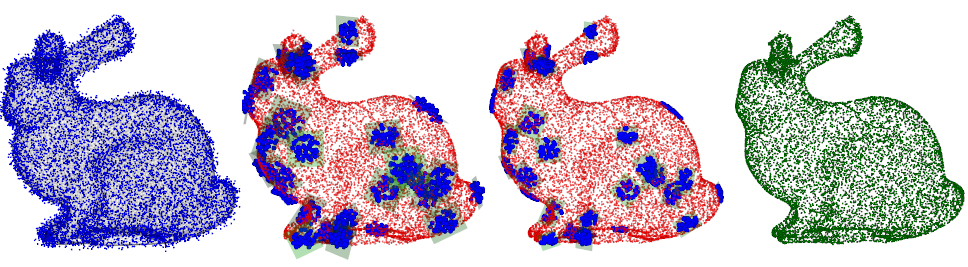
- Apply a Moving Least Squares algorithm to a large point cloud to obtain a smooth surface
from a set of scattered points in space
(script):
python examples/advanced/moving_least_squares2D.py
- Motion of particles of gas in a toroidal tank. The spheres collide elastically with themselves and
with the walls of the tank
(script):
python examples/advanced/gas.py
- Simulation of a gyroscope hanging from a spring
(script):
python examples/advanced/gyroscope1.py

- Simulation of Rutherford scattering
of charged particles on a fixed target (by T. Vandermolen,
script):
python examples/advanced/particle_simulator.py
- Quantum-tunnelling effect integrating the Schroedinger equation with 4th order Runge-Kutta method.
The animation shows the evolution of a particle in a box hitting a sinusoidal potential barrier
(script):
python examples/advanced/tunnelling2.py

- Visualizing a Turing system of reaction-diffusion between two molecules
(script):
python examples/advanced/turing.py
vp = vtkplotter.Plotter() #e.g.
vp.actors       # holds the current list of vtkActors to be shown
vp.renderer     # holds the current renderer
vp.renderers    # holds the list of renderers
vp.interactor   # holds the vtkWindowInteractor object
vp.interactive  # (True) allows to interact with renderer after show()
vp.camera       # holds the current vtkCamera
vp.sharecam # (True) share the same camera in multiple renderersThese methods return the actor object so that they can be concatenated,
(E.g.: actor.scale(3).pos([1,2,3]).color('blue').alpha(0.5) etc..).
actor.pos()                   # set/get position vector (setters, and getters if no argument is given)
actor.addpos(v)               # add v to current actor position
actor.x()                     # set/get x component of position (same for y and z)
actor.scale()                 # set/get scaling factor of actor
actor.normalize()             # sets actor at origin and scales its average size to 1
actor.color(value)            # sets/gets color
actor.alpha(value)            # sets/gets opacity
actor.N()                     # get number of vertex points defining the surface actor
actor.polydata()              # get the actor's mesh polydata including its current transformation
actor.coordinates()           # get a copy of vertex points coordinates (use copy=False to get references)
actor.normals()               # get the list of normals at the vertices of the surface
actor.xbounds()               # get (xmin, xmax) of actor bounding box (same for y and z)
actor.rotate(angle, axis, axis_point=[0,0,0], rad=False)  # rotate actor around axis
actor.clone(c=None, alpha=None, wire=False, bc=None, edges=False, legend=None, texture=None)The command vtkconvert can be used to convert a file format easily:
usage: vtkconvert [-h] [-to] [files [files ...]]

Allowed targets formats: [vtk, vtp, vtu, vts, ply, stl, byu, xml]

Example: vtkconvert -to ply myfile.vtk
# Example: transform a scalar value between -10.2 and 123.4 into a (R,G,B) color using the 'jet' map:
from vtkplotter import colorMap
r, g, b = colorMap(value, name='jet', vmin=-10.2, vmax=123.4)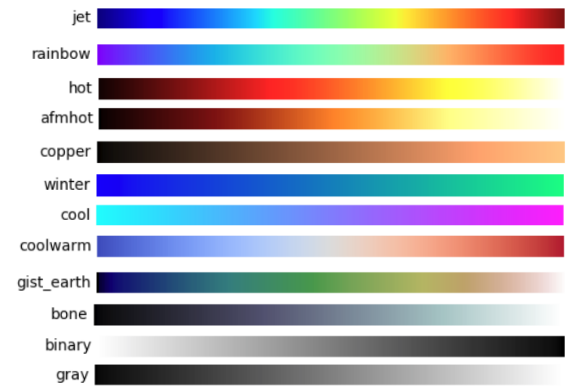
A list of available vtk color names is given here.