Skip to content

Tracking reuse of 1,000 publicly available scientific datasets across 10 repositories. Work in progress!

Notifications You must be signed in to change notification settings

NESCent/1000-datasets

Folders and files

NameName
Last commit message
Last commit date

Latest commit


Repository files navigation

Instructions

To generate all figures and analyses, just type make. Figures will be saved in the "figures" directory, and summaries of analyses in the "results" directory.

Prerequisites

  • GNU Make
  • Python 2 with the following libraries:
    • numpy
    • matplotlib
    • mpltools
  • the vegan R package (available from CRAN)

Figures

reuse histograms by repository

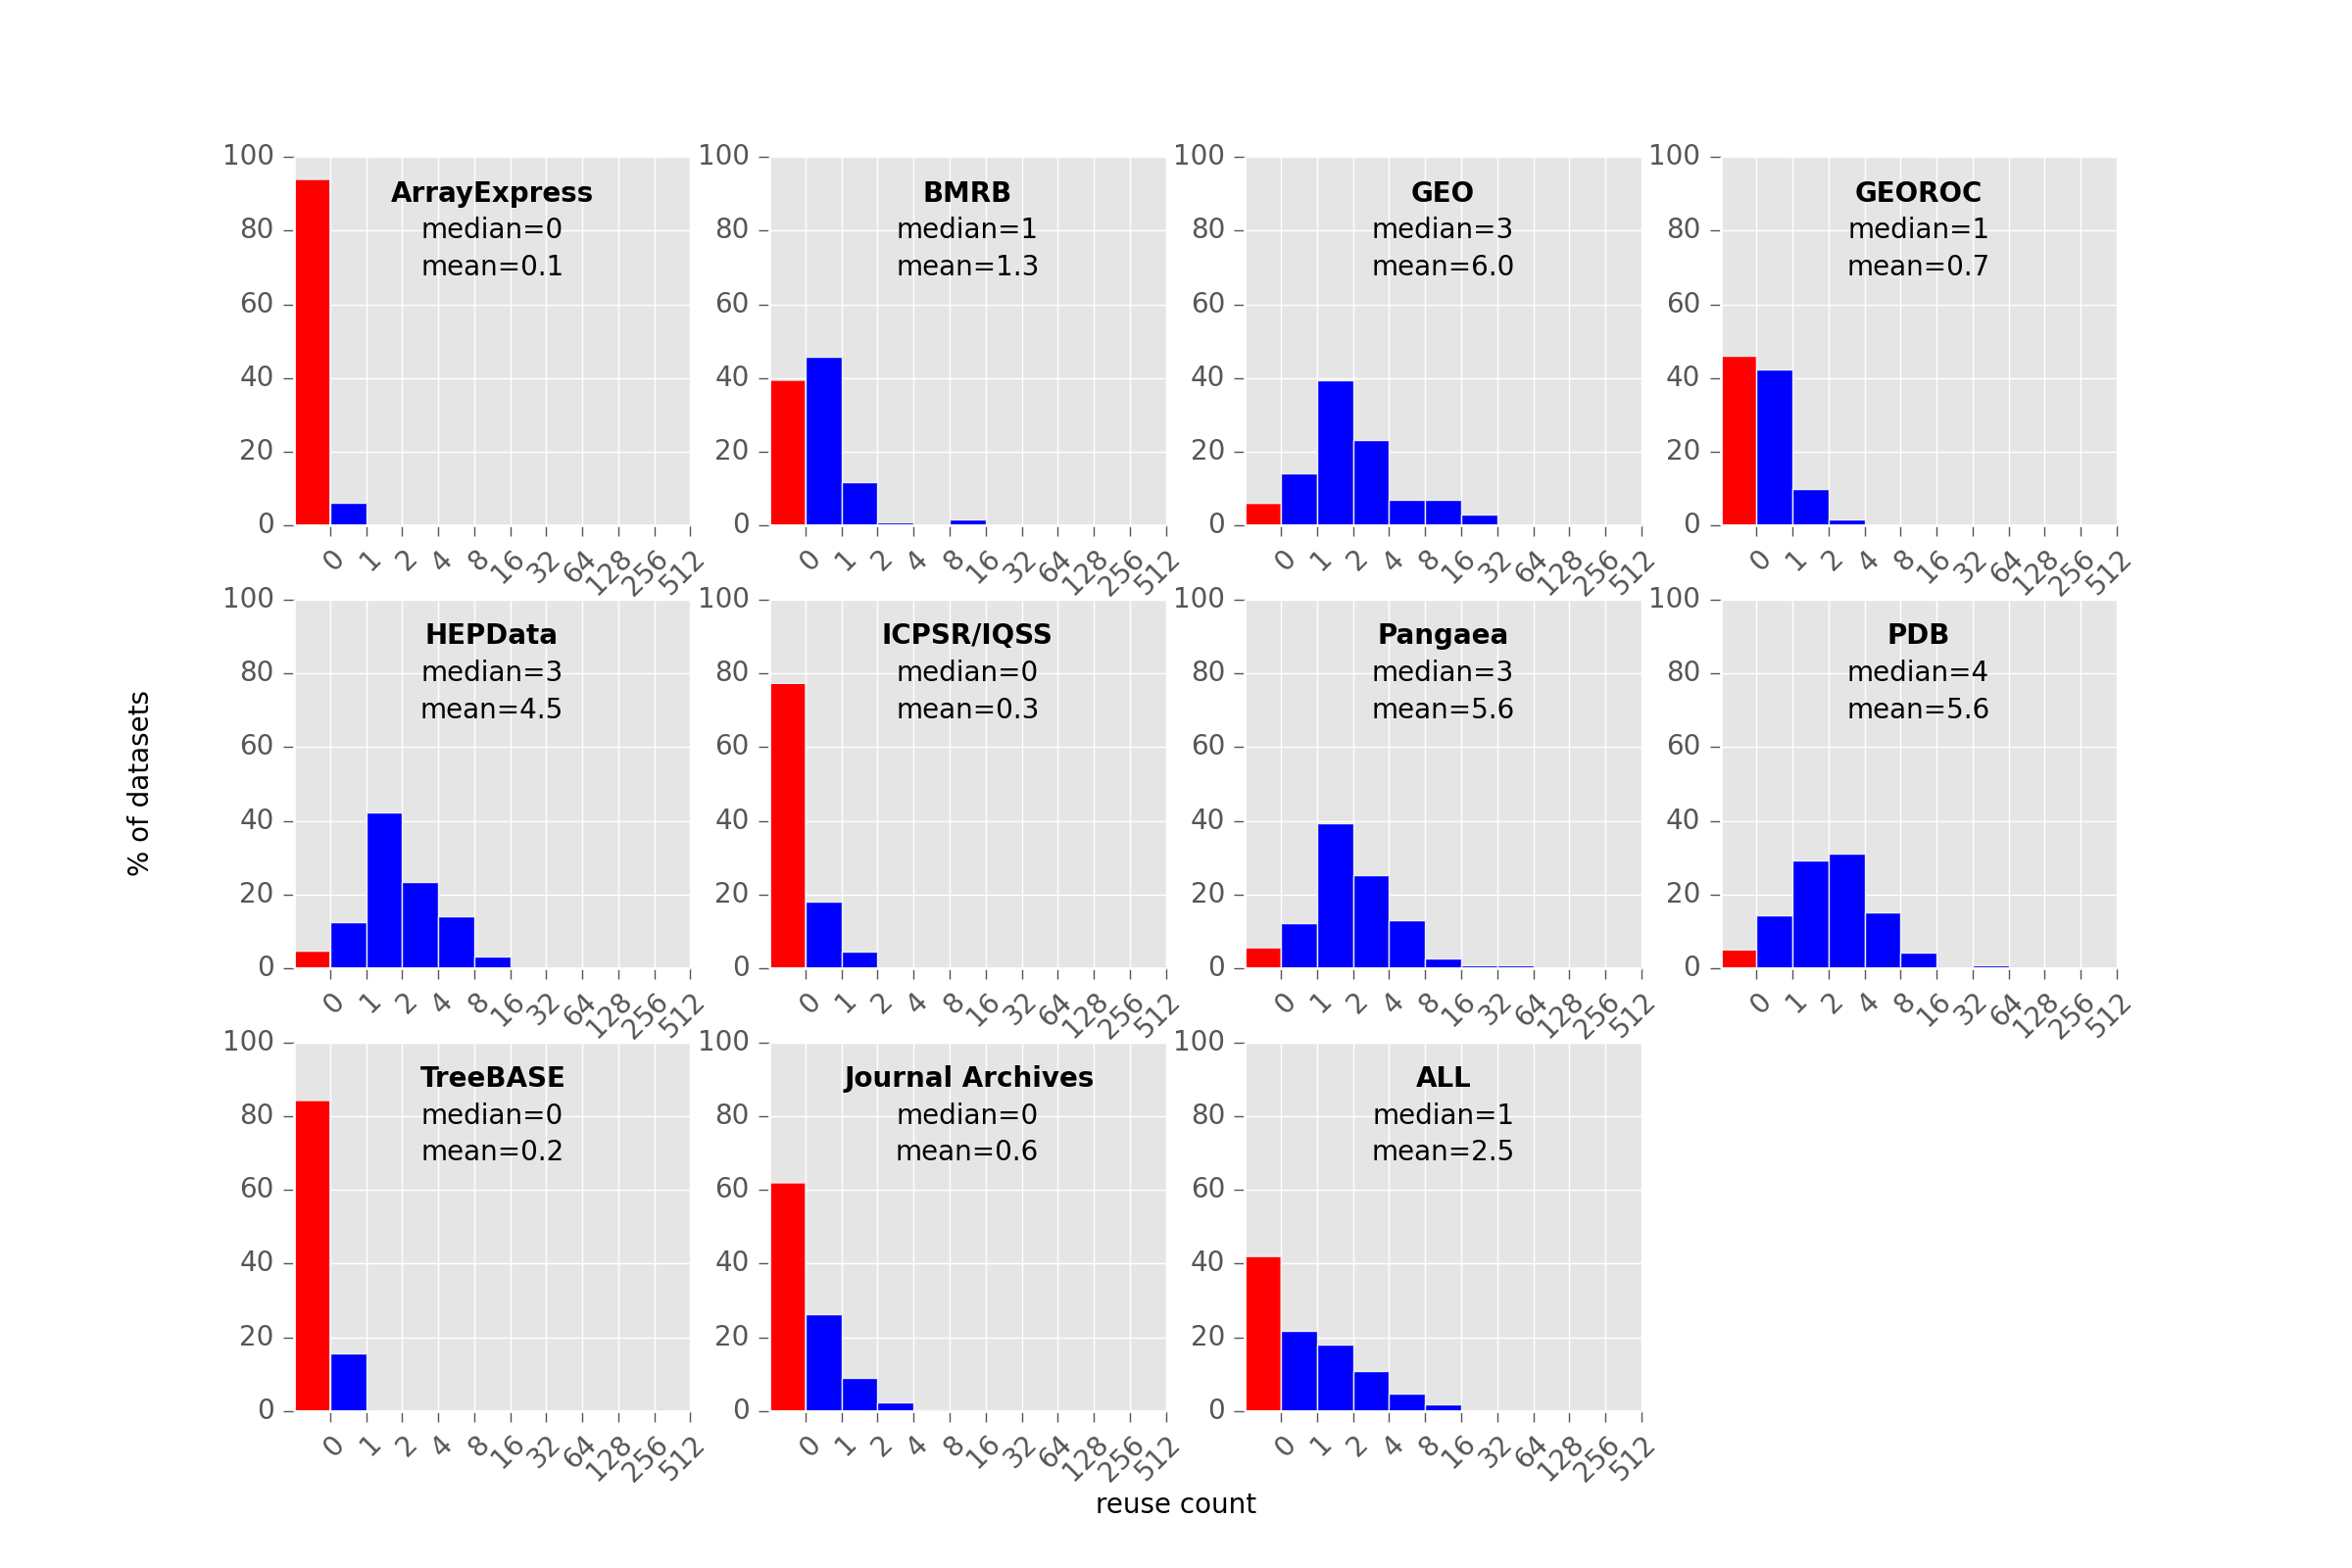
Histogram showing frequency of datasets with a given number of citations. Red bar indicates no citations.

top 100 most cited datasets

The top 100 datasets by number of times reused, and the repositories they come from.

citations and reuse

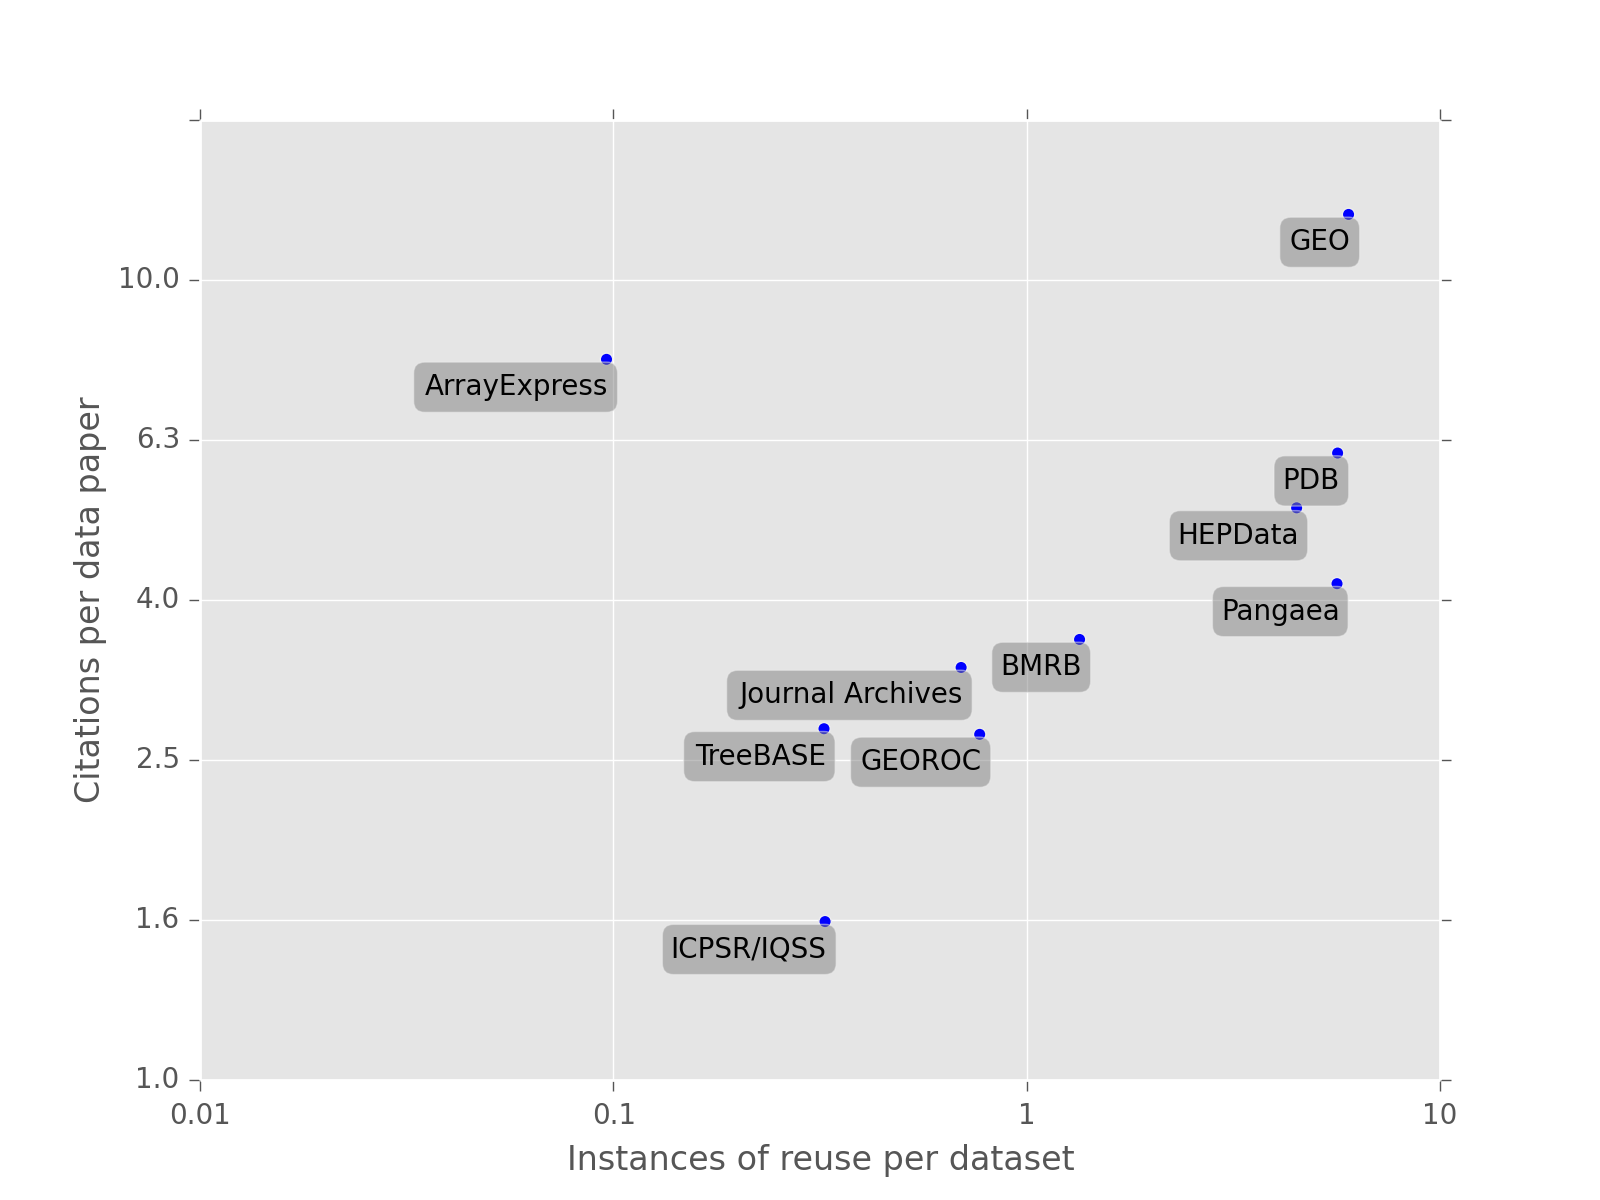
A comparison of per-dataset citation and reuse rates between repositories.

citations and reuse

Instances of reuse for a dataset. Shows median and 50%/95% confidence intervals.

About

Tracking reuse of 1,000 publicly available scientific datasets across 10 repositories. Work in progress!

Resources

Stars

Watchers

Forks

Releases

No releases published

Packages

No packages published

Languages