


- contributions
Please join https://github.com/cokelaer/spectrum
- contributors
- issues
Please use https://github.com/cokelaer/spectrum/issues
- documentation
- Citation
Cokelaer et al, (2017), 'Spectrum': Spectral Analysis in Python, Journal of Open Source Software, 2(18), 348, doi:10.21105/joss.00348
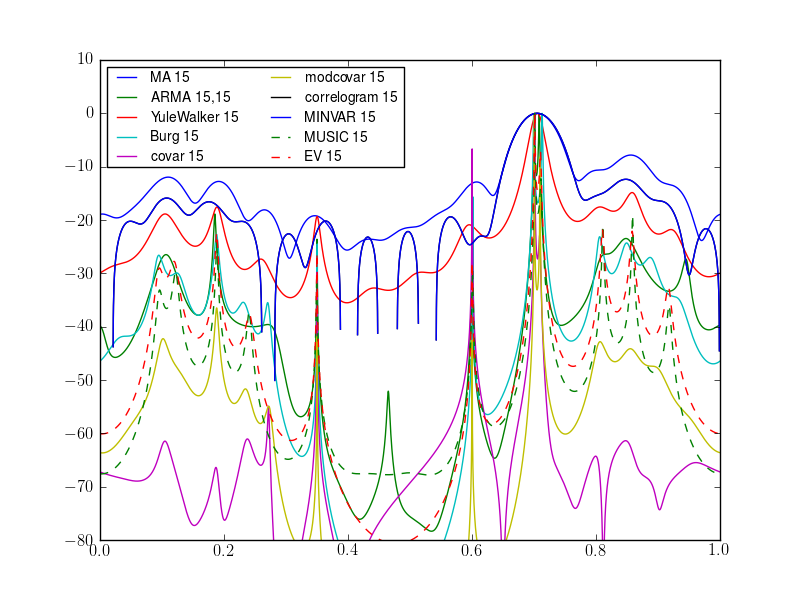
Spectrum contains tools to estimate Power Spectral Densities using methods based on Fourier transform, Parametric methods or eigenvalues analysis:
- The Fourier methods are based upon correlogram, periodogram and Welch estimates. Standard tapering windows (Hann, Hamming, Blackman) and more exotic ones are available (DPSS, Taylor, ...).
- The parametric methods are based on Yule-Walker, BURG, MA and ARMA, covariance and modified covariance methods.
- Non-parametric methods based on eigen analysis (e.g., MUSIC) and minimum variance analysis are also implemented.
- Multitapering is also available
The targetted audience is diverse. Although the use of power spectrum of a signal is fundamental in electrical engineering (e.g. radio communications, radar), it has a wide range of applications from cosmology (e.g., detection of gravitational waves in 2016), to music (pattern detection) or biology (mass spectroscopy).
spectrum is available on Pypi:
pip install spectrumand conda:
conda config --add channels conda-forge
conda install spectrum
To install the conda executable itself, please see https://www.continuum.io/downloads .
Please see github for any issues/bugs/comments/contributions.