Now deployed on Heroku: https://happy-california.herokuapp.com/
Learn more about the developer: www.linkedin.com/in/asdvalenzuela/
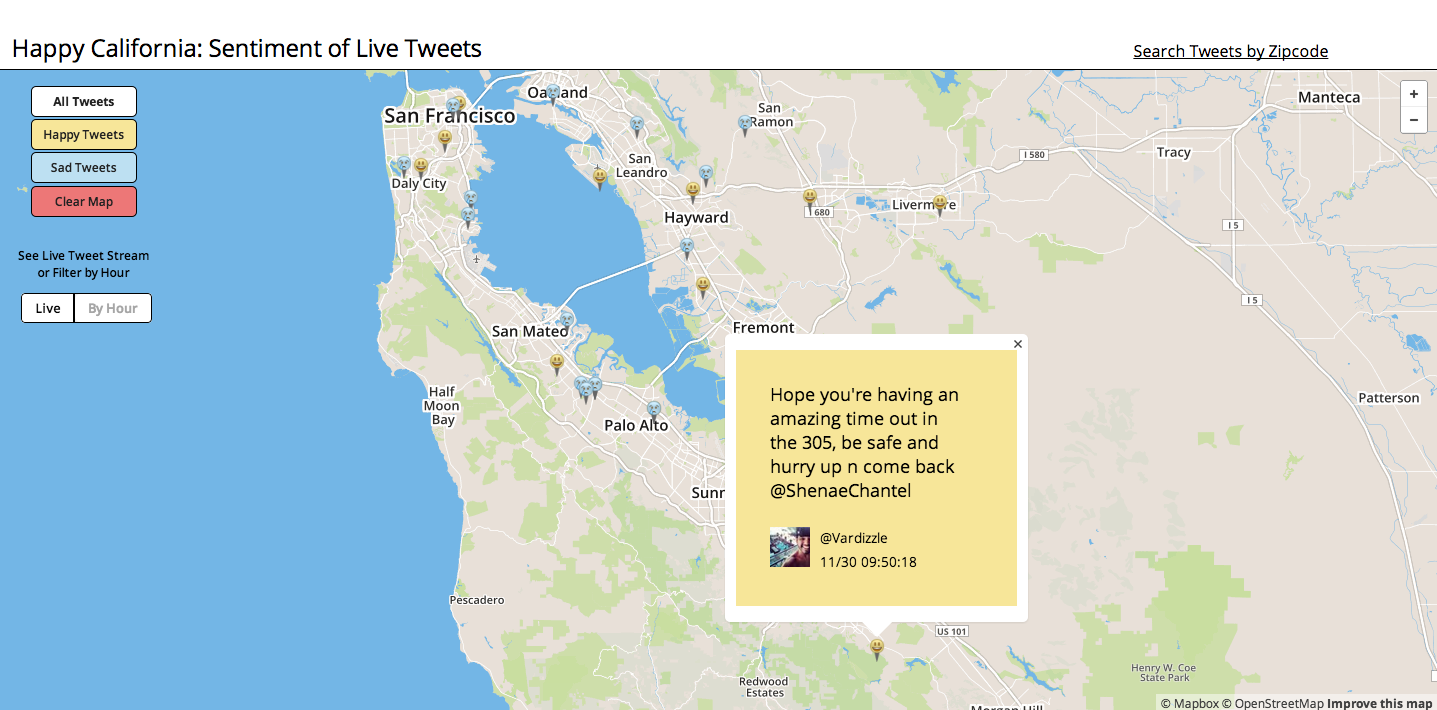
Happy California is a fullstack web application that receives live, geotagged tweets and creates a real-time measurement of the sentiment balance in the Bay Area. Using natural language processing, sentiment analysis, and machine learning, the tweets are analyzed on the fly and mapped to browse and peruse. Feeling under the weather? Filter for happy tweets. Curious if people are more negative in the morning? Check out the hour-by-hour view. Not from the Bay Area? Enter your zipcode and see the current sentiment balance for your area.

MongoDB, Leaflet/Mapbox, Pusher Websockets API, Scikit-learn, NLTK, Regex, jQuery, JS, jQuery UI, HTML, CSS, Flask, Python, Twitter API, Pickle, AJAX
(Dependencies are listed in requirements.txt)
A training set of 1.6 million pre-labeled positive and negative tweets was used to train a Naïve Bayes classifier. The set was obtained from Sentiment140. Each tweet was preprocessed using regular expressions to remove any usernames, links, and articles, then tokenized. The tokenization function authored by Chris Potts preserved emoticons so that the presence or absence of positive or negative emoticons could be used as a feature for the analysis.
The final classifier was trained using only the most useful features. To find the most informative features, a frequency distribution and conditional frequency distribution (conditions were positive and negative labels) were built. Each word was scored using a chi-square test, which compares the frequency of the word in each label to the frequency of the word in the whole dataset, and determines whether that difference is significant. After the words were scored, the top n most highly scored words were chosen. Each tweet was then checked for presence or absence of these top words during feature extraction. This process served to eliminate noise, or low-information features, in the dataset, which can decrease performance.
Many different features and combinations of features (ngrams, stopwords, stemming, different tokenization functions, etc.) were used to find the result with the most accuracy in predicting positive and negative tweets, and the highest precision and recalls scores across both labels. After training, the classifier was then serialized via the python module Pickle. The pickle file was then opened and the saved classifier used to determine the sentiment of incoming live tweets.
The classifier used in the current version of Happy California was created from buildClassifier.py, which uses NLTK as the analytical library. The file SKanalyzeTweets.py is included to demonstrate the same process using Scikit-learn, and was used to experiment with feature changes.
The tweets used to train the classifier, the incoming tweets from the Twitter Stream API, and the location information for all U.S. zipcodes are stored in MongoDB. Mongo’s ability to store varied data in a JSON-like structure for easy storage and retrieval made it ideal for this use case.
The front-end is composed of a Mapbox (built on Leaflet) map with custom markers and popups, custom CSS, and jQuery UI elements for the buttons and slider. Map interactivity is programmed with a combination of jQuery UI, JS, jQuery, AJAX, and Mapbox/Leaflet. Pusher Websocket API pushes the incoming tweets to JS, where they are mapped with Mapbox/Leaflet.
Mapbox was chosen for the mapping technology due to its customizability and well-documented API. Pusher Websocket API was helpful as the Twitter Stream API is by nature a sporadic source, so that setting an interval for AJAX requests would sometimes result in zero tweets and sometimes result in less tweets than had come in from Twitter during that interval. Pusher Websocket ensures that each tweet is pushed to the frontend as it is received, no matter the interval.


Classifier - In the future, I'd like to continue improving the classifier to see if I can get the predictions to be even more accurate.
Filter by Hour - I'd also like the user to be able to filter through all the tweets that have been posted to the area that day using the filter by hour feature, but at the moment this results in very slow loading times for the map. I have limited the map to only displaying the 2000 most recent tweets for this reason. I'd like to experiment with using a caching technology so that all tweets can be displayed while still maintaining the speed of the app.
Geolocation - I'd like to add a geolocation feature so that no matter where the user is, the map opens to that location and starts receiving tweets from that area.
#####app.py Core of the flask app, lists all routes.
#####model.py All database queries made by the flask app.
#####receiveTweets.py Establishes connection to Twitter Stream API. Incoming tweets are analyzed for sentiment, stored in MongoDB, and pushed to the frontend.
#####analyzeTweets.py Preprocesses and tokenizes incoming tweets from the Twitter Stream API.
#####buildClassifier.py Built the Naïve Bayes classifier.
#####SKanalyzeTweets.py Another version of buildClassifier.py using Scikit-learn instead of NLTK.
http://help.sentiment140.com/for-students
http://www.laurentluce.com/posts/twitter-sentiment-analysis-using-python-and-nltk/