This project contains the code for the graphical user interface (GUI) that will populate our open source database (popler). Popler contains aggregated data from numerous ecological studies on population dynamics (plants, animals, algae, etc). Popler will not be up to third normal form standards since we want to preserve all temporal and spatial replication within any data; this will allow for more accurate modeling of population dyanimcs through state-space models.
Note, this database will be accessible through R with our upcoming package Popler. https://github.com/AldoCompagnoni/popler
The data sources will come from all Long-Term Ecological Resarch (LTER) stations (26 in total). Individual datasets are given a unique id by us for book keeping purposes. See the 'current' folder for a list of datasets that will be uploaded (sorted by our created 'id' number) as of 07/11/16.
Popler has 13 tables.
-
raw_climate: Table of orginal (or aggregated) meteorlogical data from individual LTER climate stations
-
climate_station_table: Table of LTER climate station names within any LTER
-
lter_table: Table of all LTER research stations (lat/long included)
-
study_site_table: Table of designated site names from studies that gathered data at a LTER station (w/ lat & log if available)
-
site_in_project_table:
-
project: Table of metadata that describes a research study (includes temporal information, levels of spatial replication, PI's, contact emails, community data set indicator, etc). See the 'db' folder for a complete overview of fields
-
taxa_table: Table of taxonomic classifications for organisms as recording in datasheets
-
taxa_accepted_table: Talbe of taxonomic classifications after updating taxonomic information with proper keys (if applicable) and running names through taxize (in R) for most up to date classifications.
-
count_table: Table of the orginal observations gathered from the studies that contained count data
-
biomass_table: Table of the orginal observations gathered from the studies that contained biomass data
-
percent_cover_table: Table of the orginal observations gathered from the studies that contained cover data
-
density_table: Table of the orginal observations gathered from the studies that contained density data
-
individual_table: Table of the orginal observations gathered from the studies that contained individual level data (mark-recap)
The popler GUI allows people to format data for uploading to the postgres database in a repeatable, recorded, and standarized fashion. I think this could be turned into a tool to help other scientist create databases that sythensize various independent...but it may need quite a bit more work.
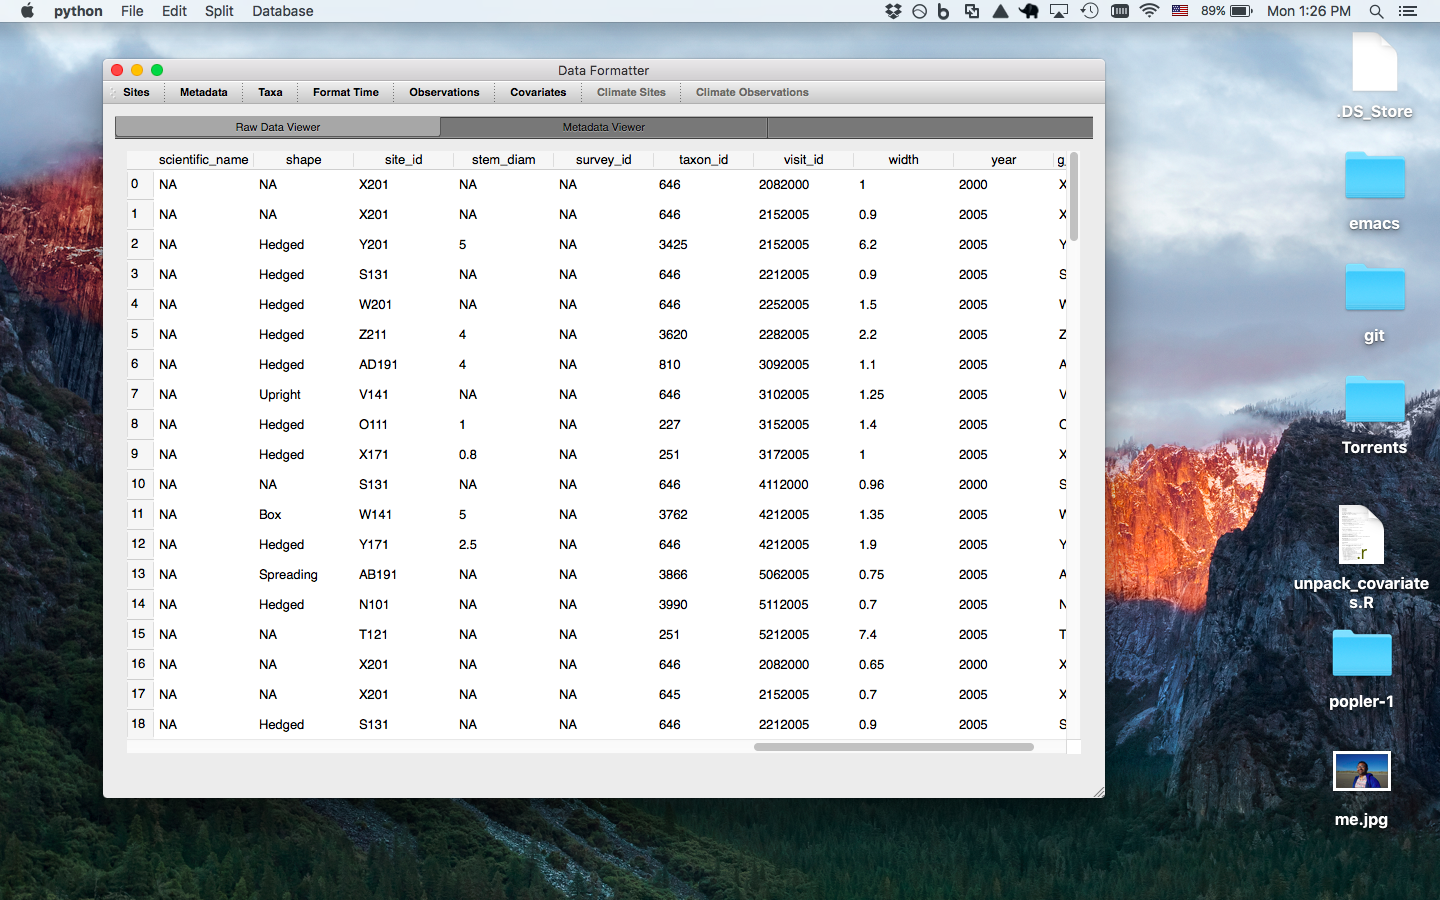
Main window displays the current dataset that will be uploaded by the program and list of datasets to upload
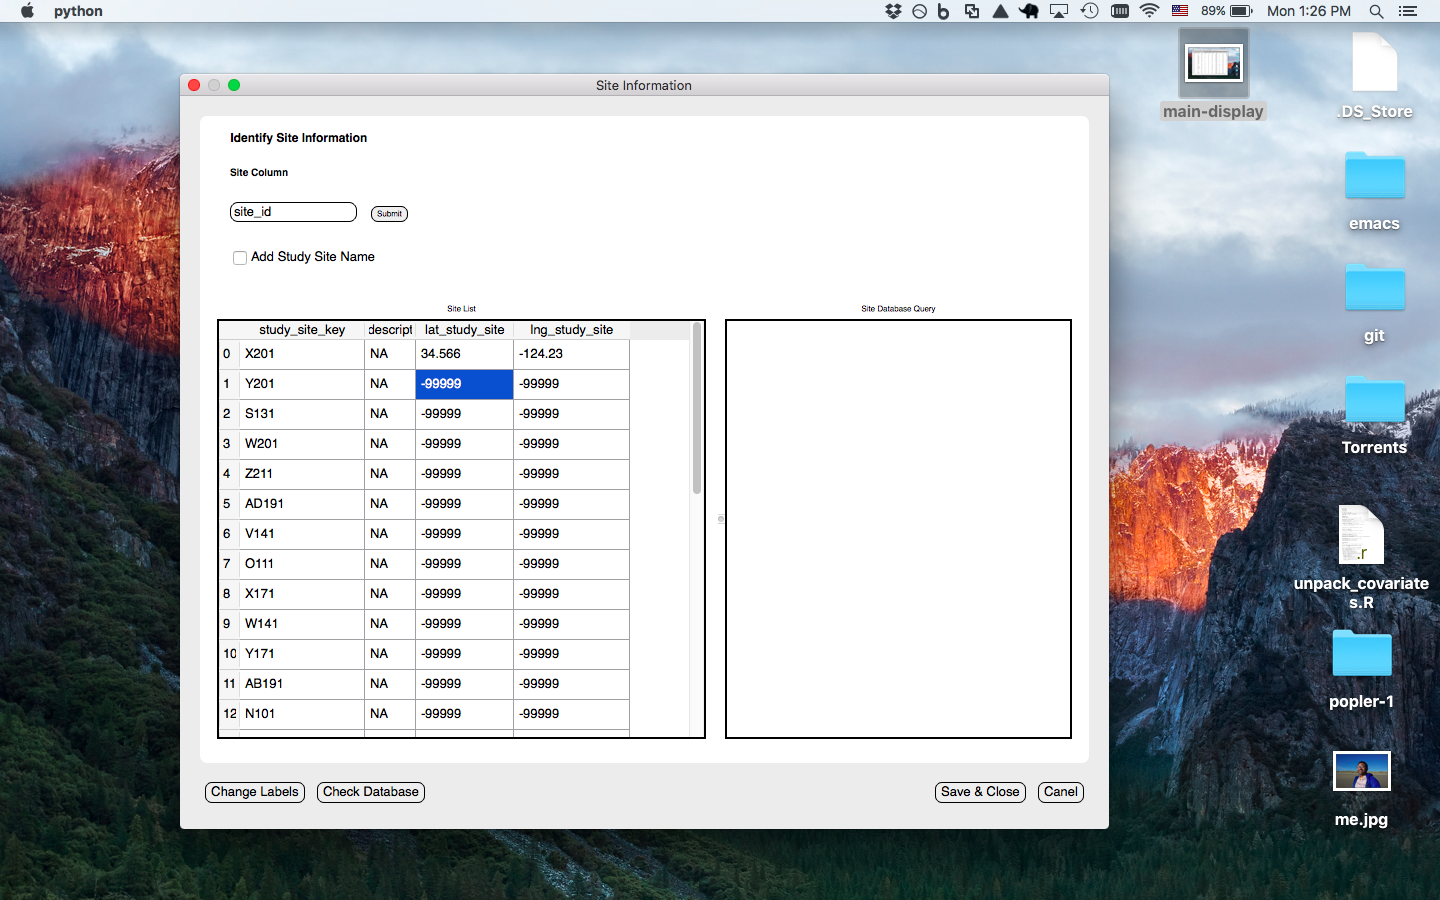
Site window prompts the user to enter the column for the 'site' level of spatial repliaction (i.e. highest level of spatial replication that data was collected over)- option to enter lat/long and check if sites are already in database
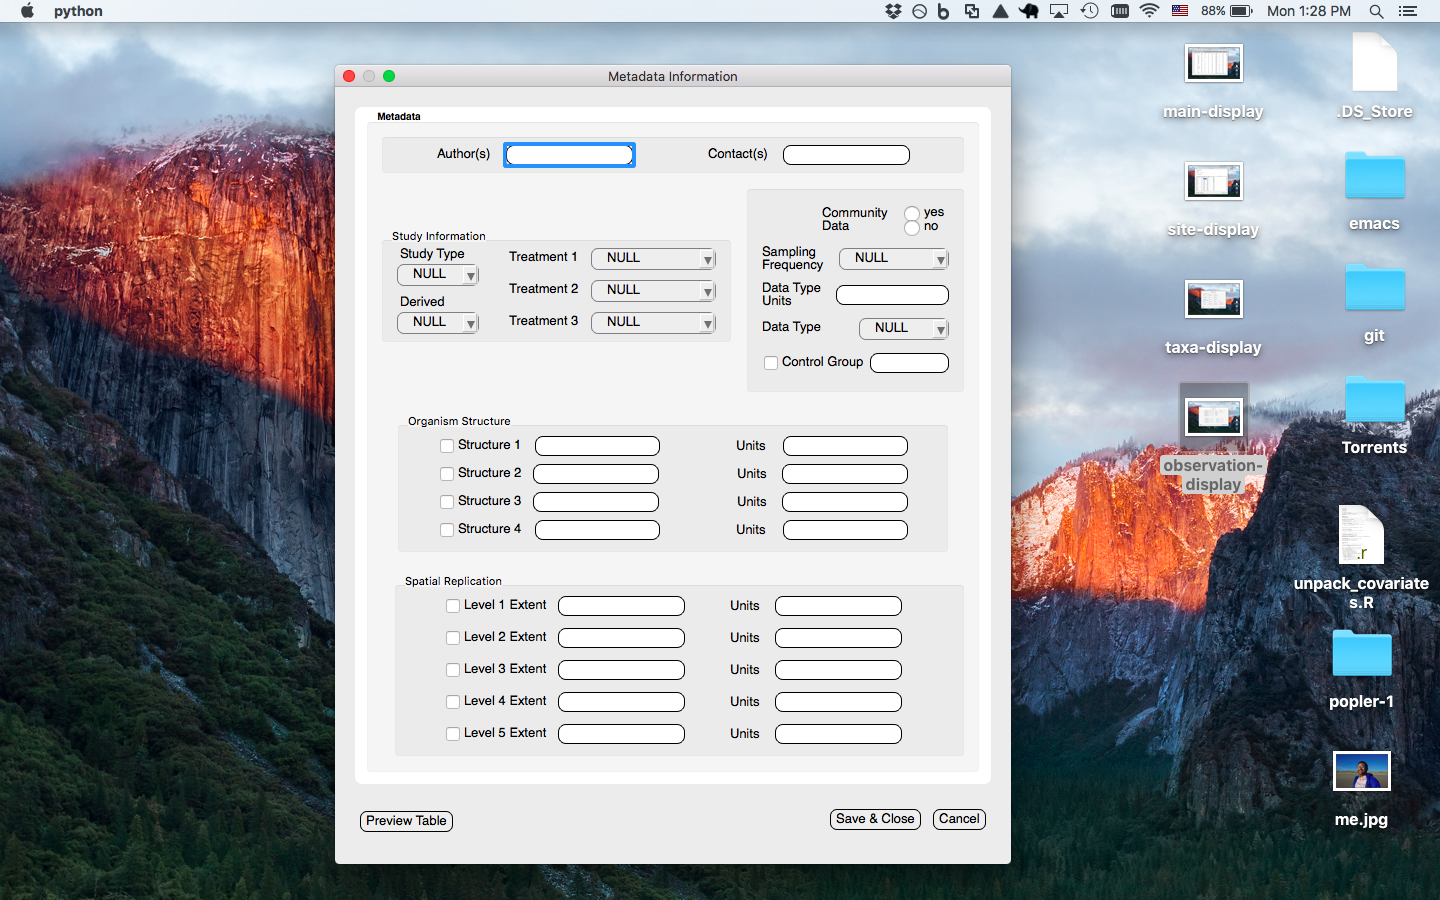
Metadata window prompts the user to enter the metadata associated with the current dataset to be uploaded
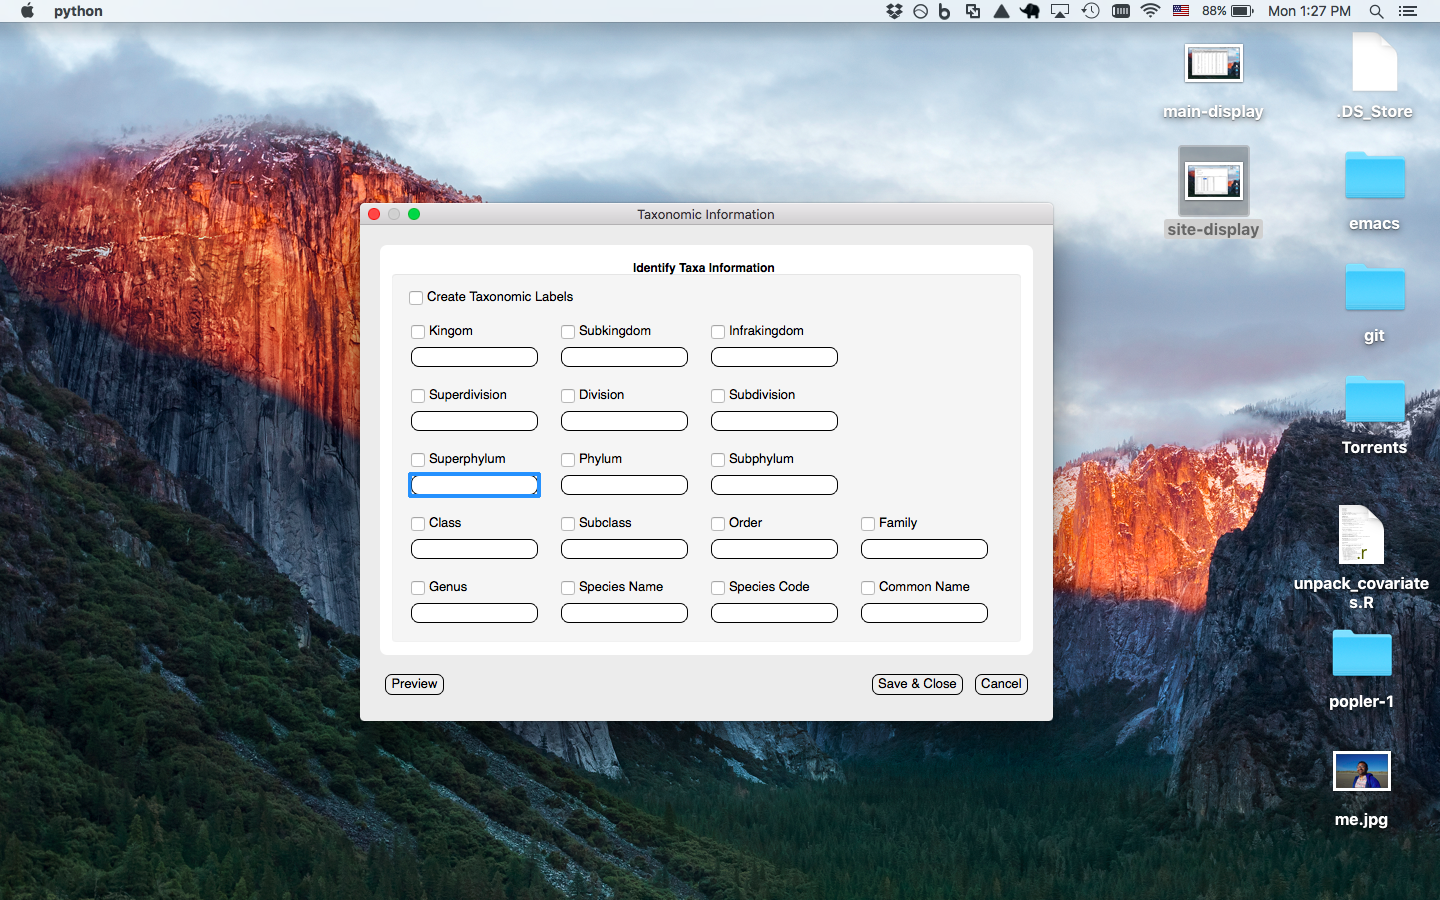
Taxa window prompts the user to enter the column(s) with the taxa information associated with the current dataset to be uploaded
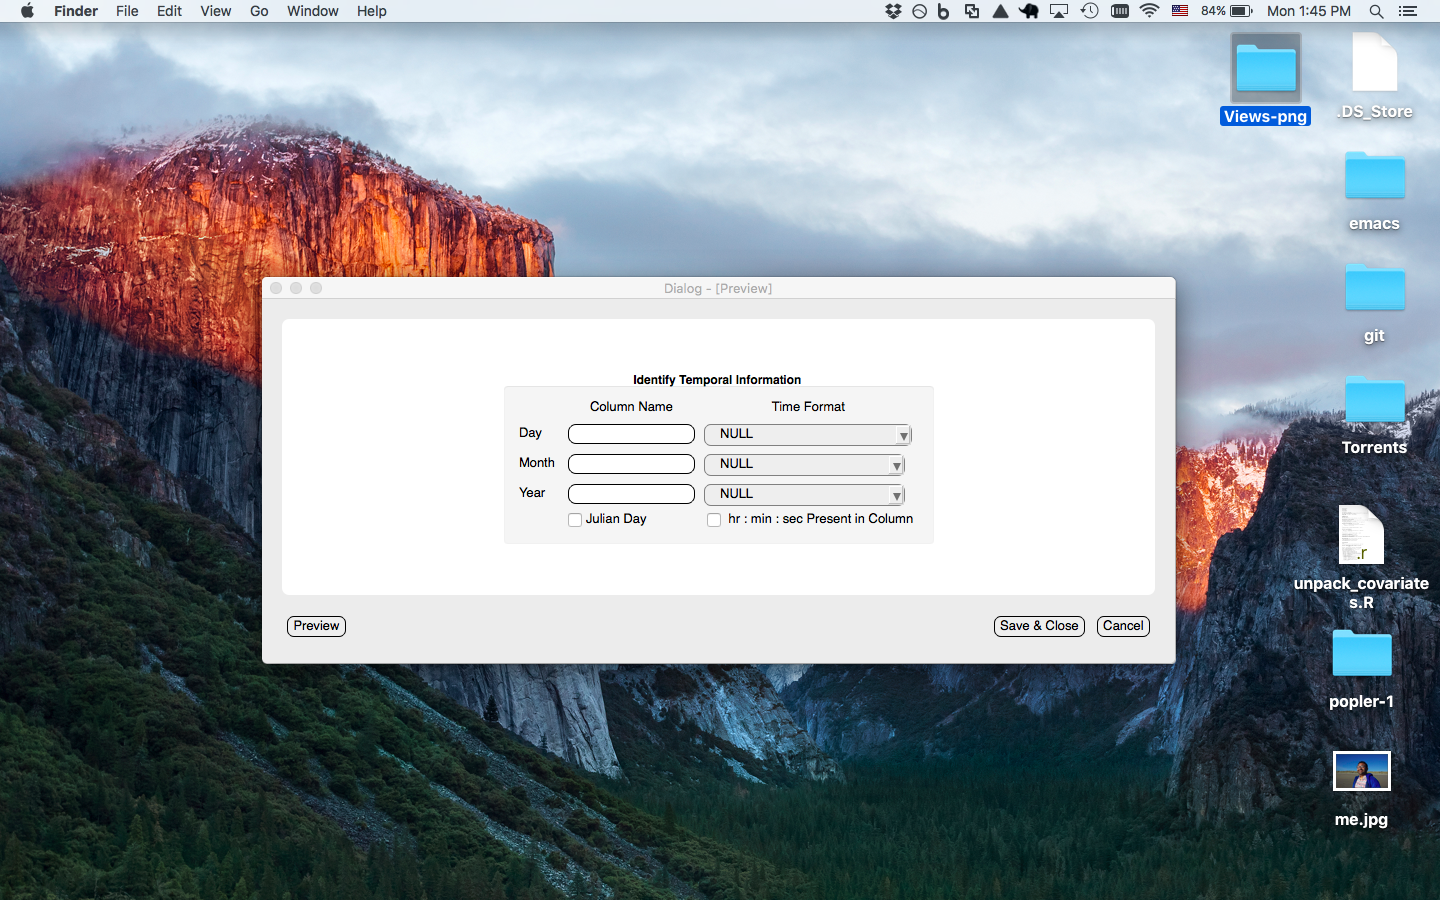
Date-time window prompts the user to enter the date column(s) associated with the current dataset to be uploaded. Can format julian date to month/day/year format
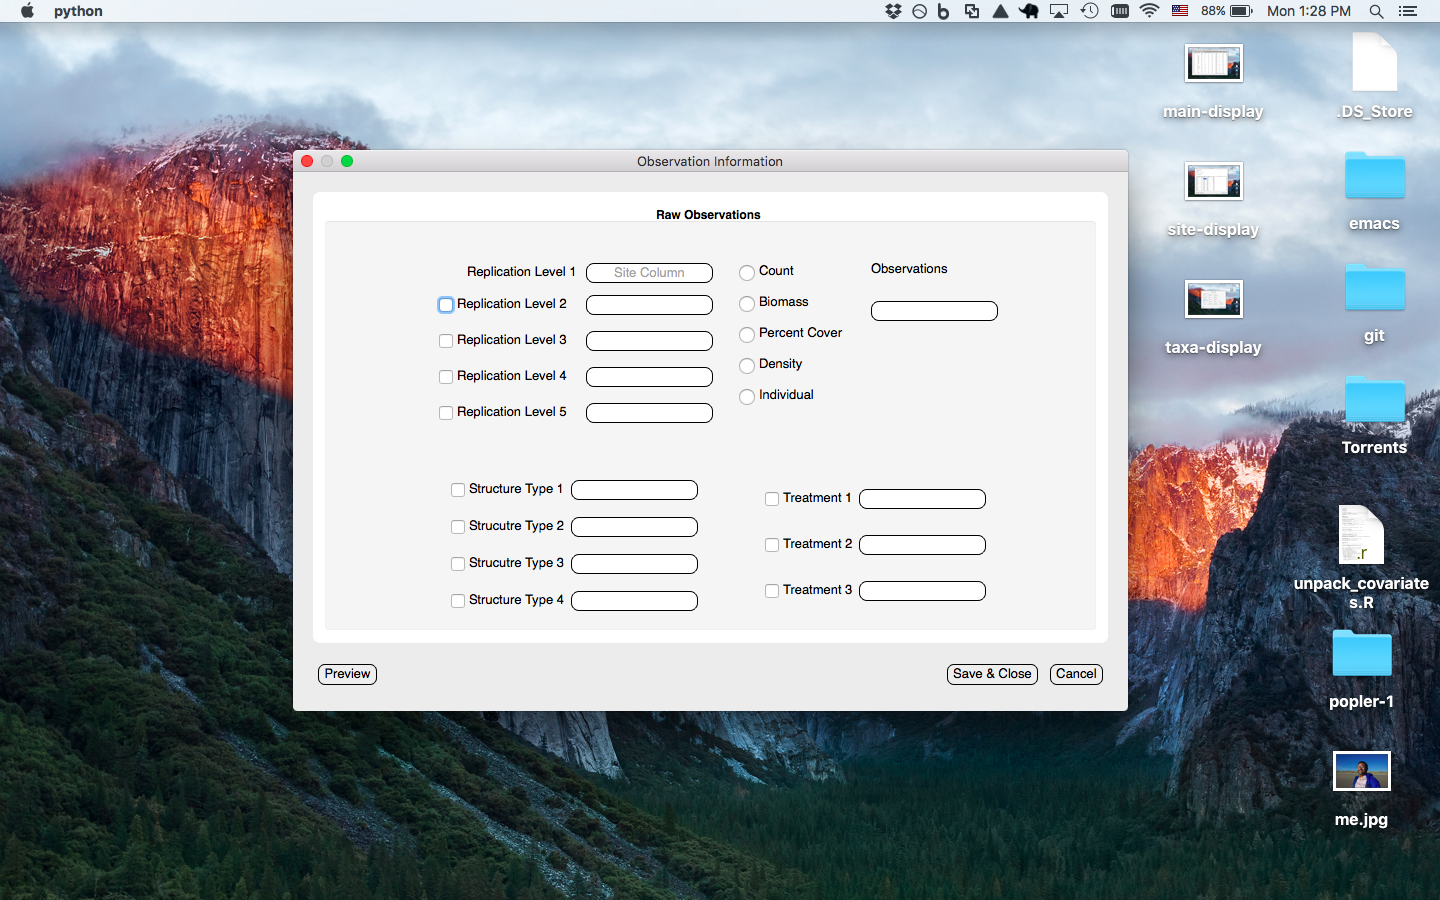
Observation window prompts user to enter the column(s) info where observation level data occur (i.e. site/plot/quadrat = spatial replication level 1/2/3, treatments, stage/age/size information, and observation types)
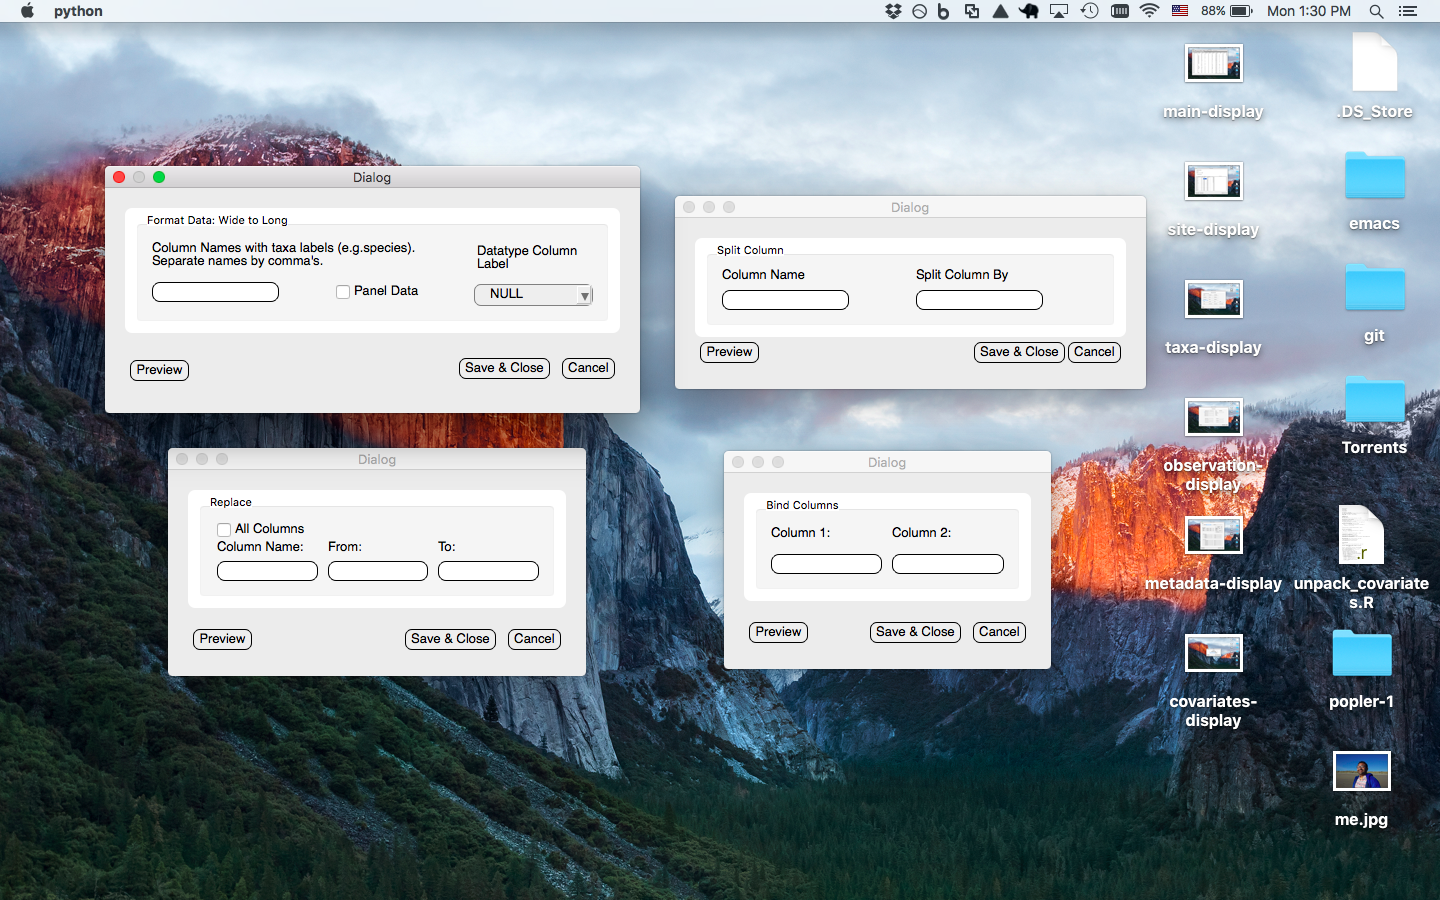
Various manipulation window prompts user to enter column(s) of values to be maniuplated (all changes are recorded in program logs)
UMLDiagrams/*: This folder contains '.dia' files with python class descriptions(an open source UML diagram creator; cross platform). The program architecture is also described within this folder. This has not been updated to reflect the current python classes (as of 7/11/16). Will update when I get a change.
current/*: Anything in this folder will be related to datasets we've catalogued and ID'ed. As well as some summary pdfs/word files (summaries were created for grant purposes).
db/*: All files related to the current schema for the database (python file to create db, csv with individual LTER information, and some test files)
poplerGUI/*: Tested python modules to run popler GUI. These files are copied over and updated from the test folder when neccessary. Logic for user views is in this directory too.
test/*: All unit test for python modules.
Views/: All Qt Designer files (.ui) for the GUI and the python equivalent (ui*.py)
poplerGUI_run_main.py: File to start script. To use this file you must have all python dependencies installed, postgresql installed, and edit the config file (poplerGUI/logiclayer/datalayer/config.py) to contect to a database created on your server/local machine.