The program accepts user location as a pair of coordinates and returns a list of the five closest events, along with the cheapest ticket price for each event.
The code adheres to the PEP8 style guide for Python.
- Number of events generated by the code can be controlled by the user. Default is twenty. You can change the number of events by changing the following line in
main.py
number_of_events = 20 # Number of events in world- The world is considered to be a square. Hence a size of 10 indicates that x-axis stretches from
-10 to 10and y-axis stretches from-10 to 10. - Number of tickets in each event cannot exceed 10 by default altough this option can be modified by the user. This is done to maintain simplicity. You can change the number of tickets by editing the following line in
grid_developer.pyinside class World ingrid_developer.py.
numberTickets = random.randint(0, 10)- Tickets for each events are stored in a list. Lets say you have 10 tickets available for event ID: 001 The tickets are stored as:
Ticket prices: 89.07 87.45 36.74 93.99 42.56 31.01 10.26 51.14 16.17 18.13
each entry in Ticket prices correspond to a different ticket and its price.
-
If there are no tickets to an event. The minimum price for the event is zero. Every time you see
$00.00, it means that event has no tickets available. -
When the number of events are more than the coordinates (size of world = 10, number of events is 120). The program aims to populate events without duplicate locations. Hence atleast twenty events are automatically dropped. Since event generation is random, sometimes more than twenty events are dropped. They are captured by the program and displayed to the user.
The program is written in Python 2.7x . You'll need to install python before running the code.
usage: main.py [-h] [--verbose]

The program accepts user location as a pair of coordinates and returns a
list of the five closest events, along with the cheapest ticket price for each
event.

optional arguments:
  -h, --help  show this help message and exit
--verbose Display events and its attributes- unittest
- argparse
unittest is a package that is used for creating test suites in python. You can skip testing by not running python unit_test.py.
Argparase is a tool that captures command line arguments. In this case, argparse is used to capture verbosity. By passing --verbose the contents of the world with all its events can be displayed in command line. This can be used to verify the accuracy of the program.
git clone https://github.com/gautam678/Grid-developer.git
cd Grid-developerI have created a test suite with a small set of examples to test if the program works according to the scenerio. In order to run unittests. Do the following:
python unit_test.pyThe output should be as follows:
Test for event object passed
.Test for ticket object passed
.Location is not unique, skipping :  9
Test for world object passed
.Test for Manhattan distance passed
.
----------------------------------------------------------------------
Ran 4 tests in 0.001s

OKpython main.py --verboseThis would display the list of events along with the expected output. You can choose to hide the details about events by ignoring --verbose.
Event Number:  1
Location (1, 2)
Ticket prices:  89.07 87.45 36.74 93.99 42.56 31.01 10.26 51.14 16.17

Event Number:  2
Location (-5, 2)
Ticket prices:  74.76 09.47 07.00 26.01 55.09 83.21 79.45 92.51

Event Number:  3
Location (2, 3)
Ticket prices:  31.76 21.19 53.46

Event Number:  4
Location (2, 2)
Ticket prices:  42.54 25.35 80.89 57.94

Event Number:  5
Location (5, 7)
Ticket prices:  12.47 28.72 89.91

Event Number:  6
Location (6, -2)
Ticket prices:  34.51 85.81 09.85 73.61 97.08 42.17 46.27 13.83

Event Number:  7
Location (-5, -6)
Ticket prices:  07.71 30.34 11.22

Event Number:  8
Location (1, -2)
Ticket prices:  93.44 31.33

Event Number:  9
Location (1, 8)
Ticket prices:  95.63 60.72 86.34 07.38 72.94 33.94 32.44 76.42

Event Number:  10
Location (5, -3)
Ticket prices:  28.30 92.53 61.24

Event Number:  11
Location (-5, 1)
Ticket prices:

Event Number:  12
Location (-5, 0)
Ticket prices:  85.10 54.66 75.78 25.68 69.03 98.63 16.09 92.40 97.57 37.06

Event Number:  13
Location (7, 10)
Ticket prices:  46.55

Event Number:  14
Location (2, 6)
Ticket prices:  74.68 69.99

Event Number:  15
Location (8, 5)
Ticket prices:  60.20 54.24 46.25 40.87 46.34 49.35 39.41 15.22 39.97

Event Number:  16
Location (9, -4)
Ticket prices:  82.58 45.44 22.36 87.14 94.59 31.45 66.55 74.85 61.85 12.79

Event Number:  17
Location (-6, 5)
Ticket prices:  66.82 28.51 87.21 77.10 48.53 84.77

Event Number:  18
Location (-4, 1)
Ticket prices:  95.89 92.86 34.42 77.48 30.15

Event Number:  19
Location (8, 8)
Ticket prices:  04.46 30.91 17.77 50.43 04.60 07.15 10.75

Event Number:  20
Location (8, 2)
Ticket prices: 93.44 56.72 83.97 43.61 60.68 17.38 44.66 10.44 46.27Please Input Coordinates: -5,1
Closest Events to (-5 , 1):
Event 002 - $07.00, Distance 1
Event 017 - $28.51, Distance 5
Event 001 - $10.26, Distance 7
Event 007 - $07.71, Distance 7
Event 018 - $04.46, Distance 7
We could use the data structure, array hash table.
A hash table is a data structure that maps a key to its value. The hash function will assign each key to a unique bucket, but most hash table designs employ an imperfect hash function, which might cause hash collisions where the hash function generates the same index for more than one key. We make use of chaining to prevent hash collisions.
Chaining is a way of linking values that belong to the same key thereby avoiding collision. A variant called array hash table uses dynamic array to store all entities that share the same key. Each newly inserted entry gets appended to the end of the dynamic array that is assigned to the slot.
In python, a array hash table can be implemented using a dictionary pointing to a list of values. Since python doesn't have the concept of arrays, we make use of lists.
- Store a dictionary (hash table) with key pointing to location and value with the list of events in that location
- Add unique values as an element to the dictionary ( store location as key and event as value)
- If we encounter another event in the same location, append to the list of events.
In the above case, if a location has five events and is closest to the query point. Closest five events would all return from the same location. In order to show results from different events. Have a flag to monitor locations and add a condition to search in locations only where flag is set to False.
In case of larger world size, a optimized approach can be used to find the nearest neighbours from the query point. Once we populate our world with coordinates of events, we can put them into a spatial index. In case of events, they don't change their location very often. Hence making a spatial index incurs initial cost of processing data, whereas searches are instant.
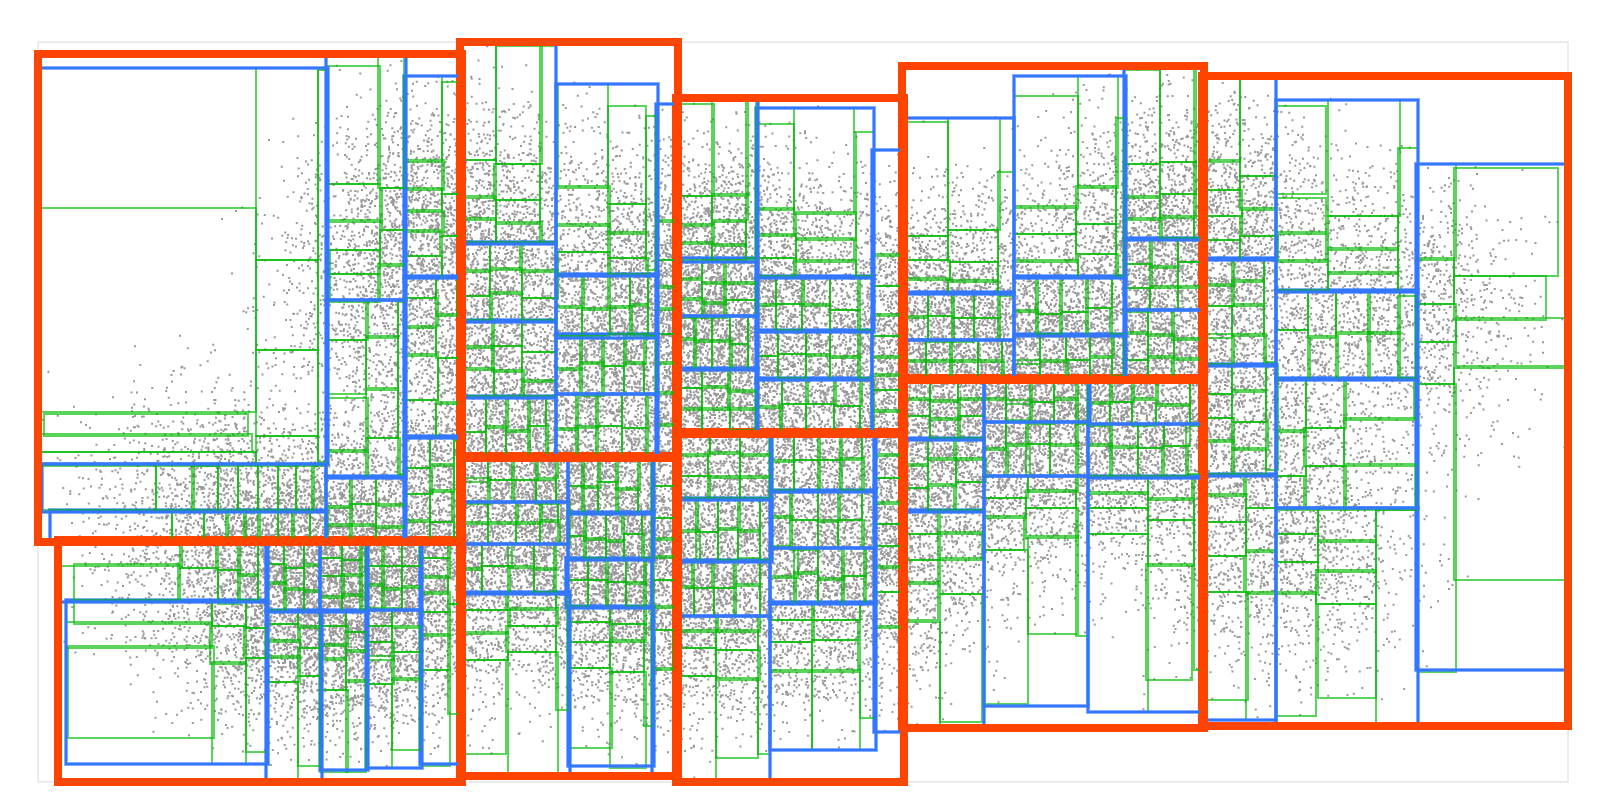
For this case, we can use the spatial data structure called R-trees.
The idea behind R-tree is to cluster nearby events and represent them with their minimum bounding rectangle (box). This minimum bounding rectangle keeps increasing in size until it encloses the virtual world. At the leaf level, each rectangle describes a single coordinate; at higher levels, it is made up of aggregation of smaller rectangles.
In the end our world is made up of minimum bounding rectangles that covers all points. Our world now looks something like this:
In order to find the nearest neighbours, we can make use of priority queues on r-trees.
Priority queues are like queues but differ in the fact that each element has a priority associated with it. In a priority queue, an element with high priority is served before an element with low priority. If two elements have the same priority, they are served according to their order in the queue. This gives us a way to pull the smallest one out quickly.
- Make an r-tree with the existing world coordinates.
- arrange the biggest boxes into a priority queue in the order from nearest to farthest from query point.
- unpack the nearest box removing it from the queue and putting all its children (smaller boxes) back into the queue alongside the bigger ones.
- Repeat step 3 recursively, each time putting its children back into the queue.
- When we reach the leaves, pop the leaves out, the first 5 leaves will be the closest to the query point.