Bamboo is a library that provides a set of tools for plotting, manipulating, and modeling data. It is built on top of Pandas and is designed to work well with Scikit-Learn.
The primary goal of Bamboo is provide a set of utilities that make common data manipulations simple and easy and to reduce boilerplate when plotting or modeling. Its design has an emphasis on immutable and composable functions that can be chained together to form more complicated data transformations. It is in particular designed for exploring data that can be grouped together intro various classes, which is common in problems involving classification.
Often, the first step in data analysis is visualization. Bamboo provides functions to quickly explore a dataset.
We start by assuming that we have a Pandas DataFrame of the following form:
| id | class | feature1 | feature2 | feature3 |
|---|---|---|---|---|
| 1 | 0 | 10.0 | 100 | "A" |
| 2 | 0 | 10.0 | 200 | "B" |
| 3 | 1 | 20.0 | 150 | "A" |
| 4 | 1 | 25.0 | 250 | "B" |
| 5 | 2 | -15.0 | 0 | "A" |
| 6 | 2 | -25.0 | 20 | "B" |
Specifically, we have a column (or possibly several) that can be used to group the data, and then we have a number of columns that can be interpreted as features (which can be either numeric or nominal/string-like).
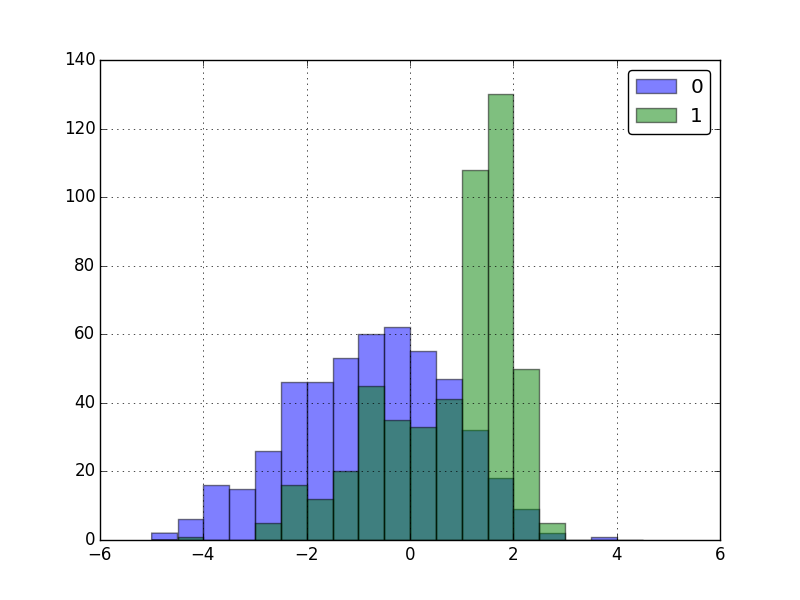
A common thing to do when faced with data of this structure is to visualize the distribution of the various features across classes. This allows us to determine if a particular has the power to distinguish between classes. One way to visualize this is by creating overlapping plots of data broken up by a class. This is easy with bamboo.
from bamboo import hist
hist(df.groupby('group').feature1,
	ax=plt.gca(), bins=np.arange(-50, 60, 10), alpha=0.5)
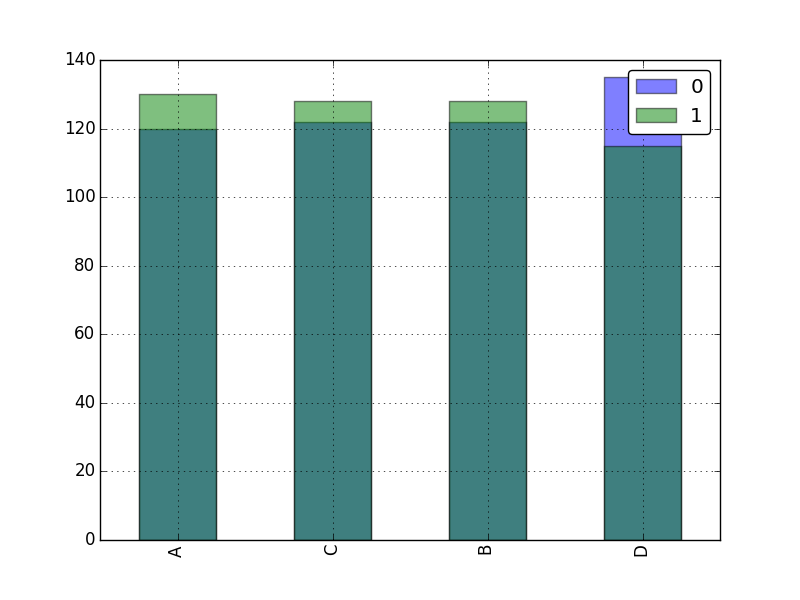
The "hist" function works on both numeric and nominal features
hist(df.gropupby('group').feature3, alpha=0.5)
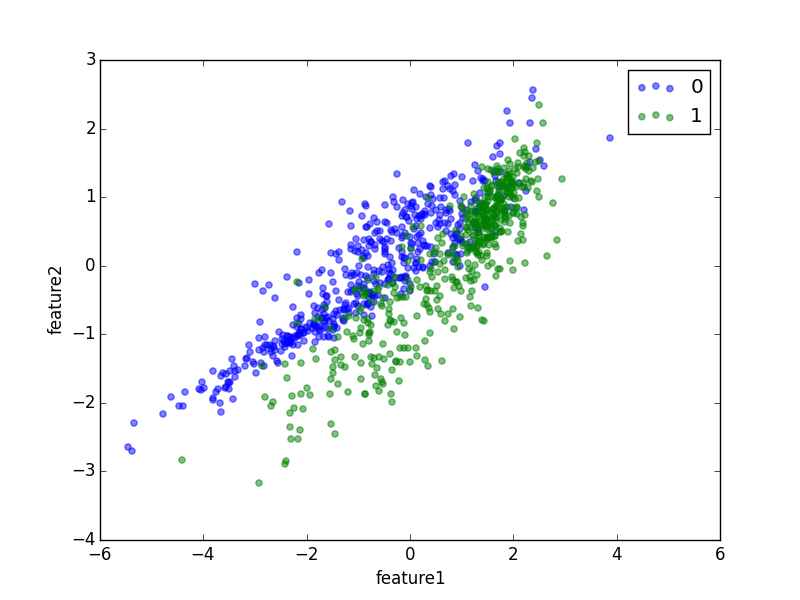
One can also visualize the relationship between features using a scatter plot with points from different groups labeled separately
from bamboo import scatter
scatter(df.groupby('group'), 'feature1', 'feature2', alpha=0.5)
One can easily create a table containing plots of every column in a DataFrame. Simply pass a DataFrameGroupBy to the hist_all function:
bamboo.hist_all(df.groupby('group'), alpha=0.5)
One can pass in any arguments that the normal 'hist' function takes.
If one wants to have more control over how each plot in the table looks, one can pass a specific function that creates each plot:
def plot_func(sgb):
    hist(sgb, alpha=0.5, autobin=True)
    plt.title("Title: {}".format(sgb.name))

bamboo_hist_all(df.groupby('group'), plot_func=plot_func)
If one calls hist_all with additional keyword-arguments, they will be automatically forwarded to the supplied plot_func (which may or may not be written to accept such arguments, that's up to the user).
For these examples, assume that we have a Pandas DataFrame structured similarly to the following:
| id | class | feature1 | feature2 |
|---|---|---|---|
| 1 | 0 | 10.0 | 100 |
| 2 | 0 | 10.0 | 200 |
| 3 | 1 | 20.0 | 150 |
| 4 | 1 | 25.0 | 250 |
| 5 | 2 | -15.0 | 0 |
| 6 | 2 | -25.0 | 20 |
Much of bamboo's functionality involves manipulating grouped data frames, something that proves to be extremely useful in common data analyses.
Imagine that we want to group our data by the class column but only return those groups that have an average of feature1 > 0:
filter_groups(df.groupby('group'), lambda x: x['feature1'].mean() > 0)
| group | feature1 | feature2 | ||
|---|---|---|---|---|
| group | ||||
| 0 | 0 | 10 | 100 | |
| 0 | 0 | 10.0 | 200 | |
| 1 | 1 | 20.0 | 150 | |
| 1 | 1 | 25.0 | 250 |
The return value is a DataFrameGroupBy with only two of the three groups remaining (those that satisfy the given predicate).
Bamboo functions are meant to be composable. So, let's say that I want to group by the group, filter out groups with a small mean of feature1, and then sort the reamining groups by their mean of feature 2. One can simply do:
sorted_groups(filter_groups(df.groupby('group'), lambda x: x['feature1'].mean() > 0), lambda x: x['feature2'].mean())
While this works, composing functions like this can make them become less and less readable (and makes it harder to write).
Pandas' new pipe operator makes this type of composition easier (note that this only works in the master branch of pandas until 16.3 is released). Now, one can write the following:
df
.groupby('group')
.pipe(filter_groups, lambda x: x['feature1'].mean() > 0)
.pipe(sorted_groups, lambda x: x['feature2'].mean())
Notice that the result of each transformation is automatically passed to the next transformation. This allows one to do more complicated transformations by chaining methods in succession:
df.groupby('group') \
    .pipe(filter_groups, lambda x: x['group'].mean() > 0) \
    .pipe(sorted_groups, lambda x: x['feature2'].mean()) \
    .pipe(map_groups, lambda x: x['feature1'].mean()) \
    .sum()
Let's describe what's going here for the sake of completeness. We start by taking a normal Pandas DataFrame and convert it into a BambooDataFrame using 'wrap'. This allows us to do in line processing on it. We group it by the 'group' column, turning it into a DataFrameGroupBy. Next, we apply a filter that requires that all remaining groups have a mean of their group column greater than 0. We then sort the groups, ordering them by the mean of their 'feature2' column. Then, we map a function over each row in each group, taking the mean of 'feature2'. This turns the underlying object from a multi-column data frame into a data frame of only one column (the result of our mapping function). Finally, we take the sum of that value within each group. We end by making a histogram of the resulting object, which has a single value for each group.
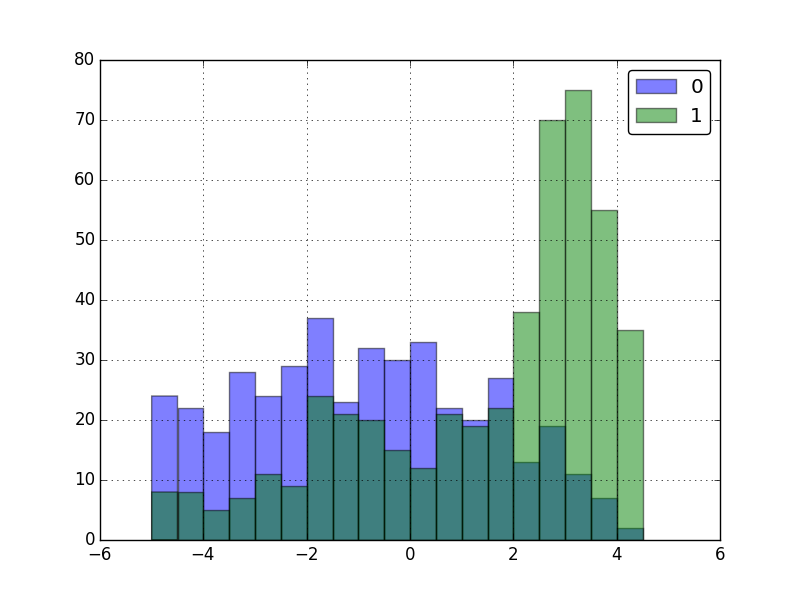
Bringing this all together, Bamboo makes it easy to manipulate and plot data:
df \
    .groupby('group') \
    .pipe(map_groups, lambda x: x.feature1 + x.feature1, name='feature_sum') \
    .pipe(hist, ax=plt.gca(), bins=np.arange(-5, 5, 0.5), alpha=0.5)
Bamboo comes with a number of functions and data structures that are designed for statistical modeling and machine learning.
A convenient way to manipulate data for the purpose of classification or regression analysis is to use the bamboo.modeling.ModelingData class. A ModelingData is a simple data structure that wraps a 2-d matrix (or pandas DataFrame) representing features and a 1-d matrix (or a pandas Series) that represents a set of targets for those features (either class labels or a value for regression).
features = pd.read_csv("features.csv")
targets = pd.read_csv("targets.csv")

data = bamboo.modeling.ModelingData(features, targets)
One can also create a ModelingData directly from a single DataFrame
df = pd.read_csv("data.csv") data = bamboo.modeling.ModelingData.from_dataframe(df, target='target')
The advantage is that features and targets can be encapsulated into a single package and manipulated as a single object. It also comes with a number of helper functions for common modeling tasks.
numeric_data = data.numeric_features()

data.hist('feature1', bins=np.arange(0.0, 10.0, 1.0))

clf = RandomForestClassifer()
data.fit(clf)
In particular, it makes it easy to do cross validation
training, testing = data.train_test_split()

training_balanced = train.get_balanced()

clf = RandomForestClassifier

training_balanced.fit(clf)

print testing.get_classifier_performance_summary(clf, target='classA')

# {'f1': 0.53846153846153844, 'target': 0.0, 'sensiticity': 0.5, 'recall': 0.5, 'false_positive_rate': 0.58333333333333337, 'false_positives': 5.0, 'precision': 0.58333333333333337, 'true_positives': 7.0, 'false_negatives': 7.0, 'true_positive_rate': 0.41666666666666669, 'specificity': 0.5, 'threshold': 0.0, 'true_negatives': 5.0, 'accuracy': 1.0}
For a more detailed example, see the documentation here.