Mission: The goal is to create a data pipeline which extracts data from 5 excel files, perform data transformation and load it to denormalized table that helps end users in accessing the data easily
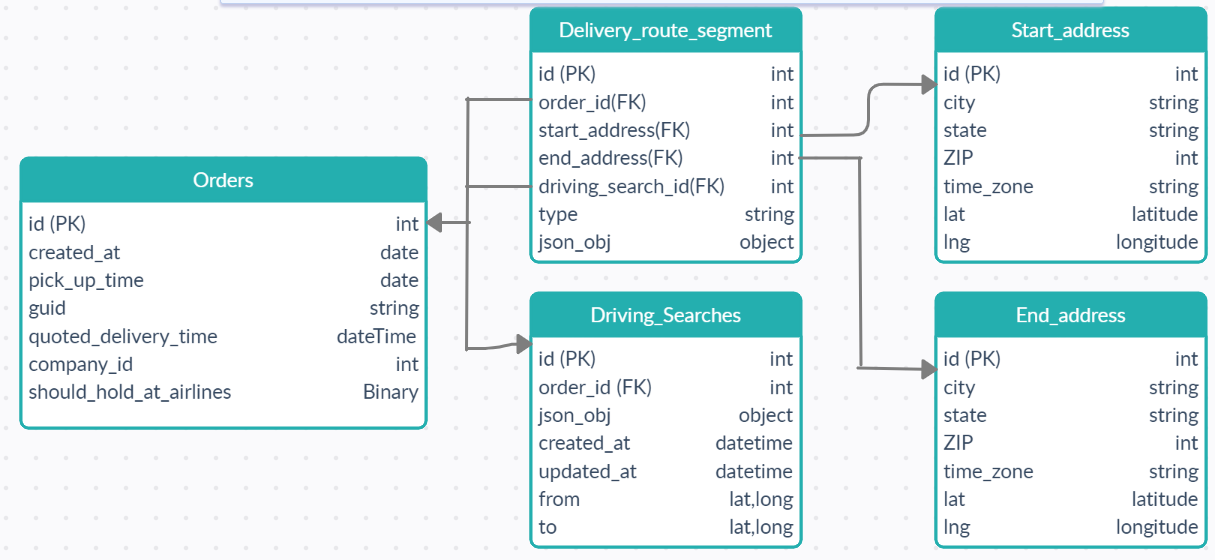
Data Summary: The data given to me consisted of 5 tables which had all the details of shipment for every order. Below is a physical model of 5 tables with their relationships.
Approach: First, I created a physical model of the data to understand the logical relationship between tables. I imported the excel files into MSSQL Server and ran SQL queries to perform exploratory analysis. I performed data cleaning and data validation on each table.
- Data Cleaning: Few of the columns in the table had special characters where it was not allowed, and state column included values which represented state ID in more than one way ( For eg: state code CA was represented as California in one of the order id ). So, I removed the special characters, corrected the error in state column and made sure that data integrity is maintained across all tables.
- Data Validation: I verified each table to make sure that there are no duplicates and there are no null values in the non-nullable columns. I made sure that there are exactly 2 driving segments and a flying segment for each NFO type. Similarly, I verified the same for DRIVE and HFPU order type. I loaded data to tables maintaining the right data format. After the data validation step, I extracted the required data from json objects using pandas. I created two tables, staging and airspaceWarehouse (Denormalized table) in Microsoft SQL Server. I loaded the transformed data to staging table. Finally, aggregated data from staging table and loaded to airspaceWarehouse. I also created a trigger to update the airspaceWarehouse when new data is loaded to staging table. To solve the additional requirement, I created a function (DistanceCalculation.sql) which calculates the distance between origin and destination locations using their respective latitudes and longitudes. And then created a stored procedure (spLongDistanceOrderId.sql) which returns the order id’s which have the longest distance between pickup and drop off locations.
Assumptions:
- The data provided is accurate. Since there was an order which had start and end city as Trivandrum, Kerala (India)
- For the HFPU order type, I assumed the flight arrival time as local delivery time of the order.
- For the NFO order type, local delivery time is calculated by adding the drop off driving time to flight arrival time.
- For the DRIVE order type, local delivery time is calculated by adding the driving time to pick up time.
- Minutes to pickup is the difference between created_at time and pickup time.
Result: Below is a screenshot of denormalized table:

Additional Information:
- I have used the MSSQL add-on of Heroku and below are the details to connect to Database. a. server = 'eu-az-sql-serv1.database.windows.net' b. database = 'dgyqjjn092cx2k5' c. username = 'u1vucvmhf3q55hq' d. password = 'Gj51GrVO#N66e$b569b980eIL'
- Code to load the data to staging table is saved as Driver.py
- Code used to build denormalized view is saved as LoadStagingToWarehouse.sql
- Code used to create function and stored procedure to retrieve the order id’s which have the longest distance between pickup and drop off locations is saved as DistanceCalculation.sql and spLongDistanceOrderIds.sql respectively. (Note: Both the functions and stored procedure have already been created)
- Execute the query “ EXEC spLongDistanceOrderIds “ to get the order id’s with longest distances