
pd6: Eric Cerny, Hon Wei Khor
pd7: Daryl Sew, Peter Jasko
Visit http://ml7.stuycs.org:7777 and begin by selecting a visualizer from the tab on the left. When the new page loads, select a tune from the tab above and watch the visualization of that tune.
If you're cloning/forking the project, please see the dependencies below.
Take a music file and visualize it, maybe let the user play around with some settings for the visualization. We'll decide on additional features later on in the project.
Using scipy/numpy/assorted libraries for fourier transform analysis of wav files.
But it kinda magically came together the morning it was due. Inexplicable, really.
Several royalty-free songs will be provided for demonstration purposes.
- wave (sudo pip install wave) - this might have been already installed along with your Python distribution, though
- scipy/numpy (sudo apt-get install python-numpy python-scipy)
- audiolab
sudo apt-get install python-dev python-setuptools libsndfile-dev libasound2-dev
sudo easy_install scikits.audiolab - sudo apt-get install chromium-codecs-ffmpeg-extra(for users of chromium in linux)
NOTE: To enable WebGL rendering on Chrome, go to chrome://flags and enable 'Override software rendering list Mac, Windows, Linux, Chrome OS'
Create waveform and spectrogram images from a wav file using Short Time Fourier Transforms (provided by numpy). To test it, type 'python svt.py -o 1 filename' and look at the pngs generated. Credit to the [Sound Viewer Tool] (https://github.com/ljvillanueva/Sound-Viewer-Tool).
Compute spectral centroid (brightness/timbre/color of the sound), volume, and frequency data at any point in time in a wav file; uses svt.processWav(filename, channel). Filename is the path to a wav file, channel is 1 for the left channel and 2 for the right channel. Returns centroids[], frequencies[][], volumes[].
VISUALIZERS.
- pause song
- change visualizer mid-song
- allow user to upload their own song
- integration with soundcloud api
1/9: Have a visualizer that can do something up on github.
1/12: Have a visualizer that is presentable (i.e. someone that looks at it will go wow, you wrote that?); import svt and use centroids, frequencies, volumes = svt.wavProcess(filename, 1) to retrieve wav data.
1/14: Most changes to visualizers should be done by now; UI is done and sample songs have been chosen; an option for the user to upload a song from his/her own computer is provided; development now focuses on interactivity with the user and API. At this point, besides the README, ABSOLUTELY NOTHING should be pushed directly to master; all work done must be done in a branch and submitted with a pull request.
1/15: Continue adding API, interactivity, and/or other features. Eric, email zamansky asking him to set up all the dependencies (refer him to our README).
1/16: API should be complete and tested with other projects.
1/17: If the due date is the next day, devote this day to debugging; host the project on the server, pass it around, see what people think, see what errors they can find or find out if our README is good enough for someone without much background in technology.
1/18: Earliest possible project due date.
Well, that didn't quite work out, did it... but okay. UI will be done 1/20, visualizers by 1/21, polishing & merging on 1/22.
Everyone will write a visualizer.
- Write something in three.js that takes inputs from {{centroids}} {{frequencies}} and {{volumes}} and draws cool things based on them.
- If your function sucks, google stuff to figure out how to draw stuff that looks cooler. Check out other visualizers and try to make ours have effects comparable in quality/etc.
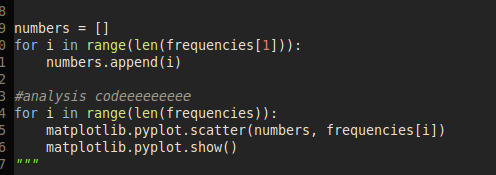
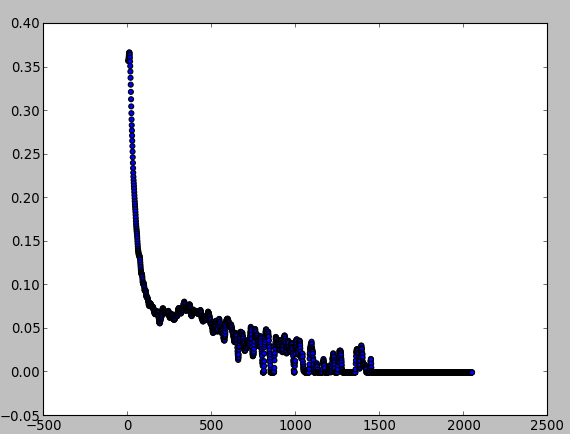
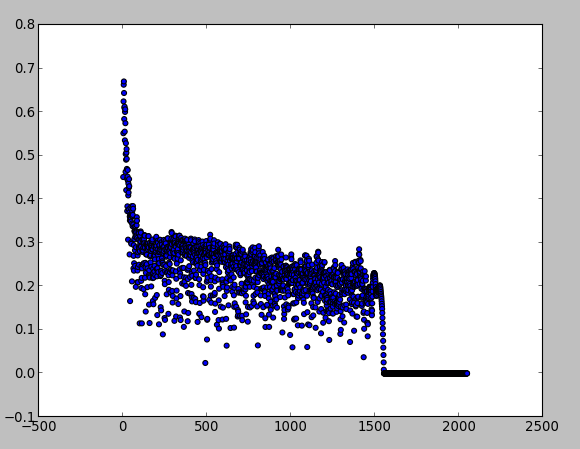
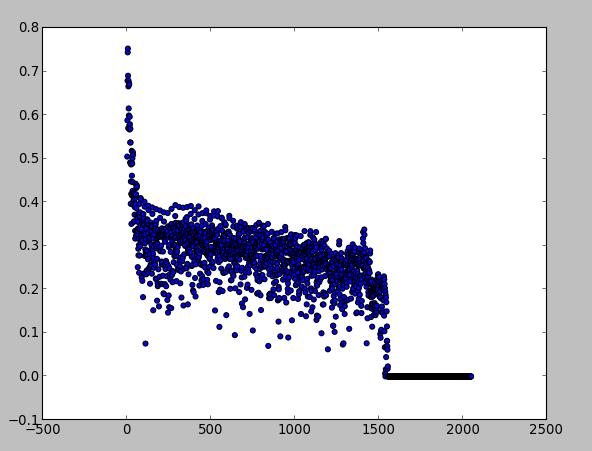
###Frequencies
####Graph generating code (for clarity)
x axis is frequency, y axis is intensity, frame x == time; note that these are just 3 frames out of several thousand
Frame 0
Frame 1
Frame 2
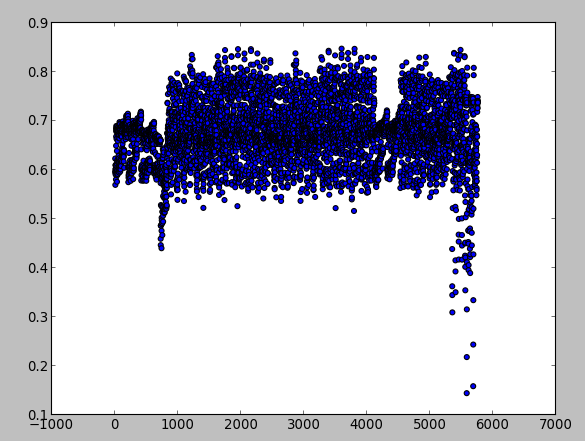
###Centroids
x axis is time, y axis is brightness (low to high)
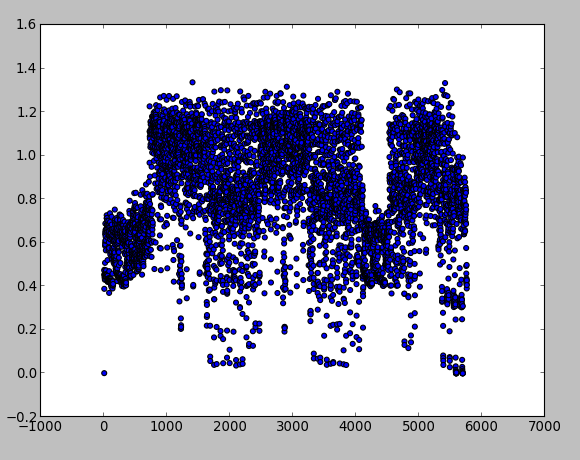
###Volumes
x axis is time, y axis is intensity (low to high)
###Summary Statistics (calculated from wubwub.wav)
####Volumes
Max: 1.33679199219
Avg: 0.815959368812
Min: 0.000152587890625
Std: 0.260528895602
Med: 0.83317565918
####Centroids
Max: 0.847659125302
Avg: 0.673952599689
Min: 0.144571311477
Std: 0.0656669159849
Med: 0.673928002227
####Frequencies
Note: These are calculated for every frequency at every point in time.
Max: 0.852132088307
Avg: 0.280983495667
Min: 0.0
Std: 0.185711063639
Med: 0.343466281233
- Peter, it'd be great if you could write up your UI idea for everyone else, maybe draw the UI design and put the png on git or something; be prepared with a backup plan in case it's too hard to implement this one (i.e. we only come up with one visualizer, etcetc). You said you'd like to do the design so if you could start writing up the html/css/etc that'd be nice (twitter bootstrap stuff is set up in the repo). If you have time or if you feel like it, you can also write the visualizer but you don't have to (although I think you probably should as I doubt the web design will be that time-consuming). I like minimalism, like Kevin's new version of stuypulse or controlgroup.com- the appearance is really important, try to make it slick. I like this site's backgrounds.
- Eric, you are responsible for the README.md file and will update it as the UI is developed. It should have very clear, detailed instructions on how to use the visualizer (make no assumptions that the user knows stuff). Write a guide on how to set up all of our dependencies and include it in the README - you will email this to Zamansky a few days before the project deadline asking him to set things up on the ml7 server.
- Hon Wei will help me write the API so other sites can use our project.
- Zach, obviously since you're not in our group, don't feel obligated to do anything, but any help is appreciated; would probably be most appropriate for you to help write an API so my project can interact with yours (and others'). This could potentially be very involved. IMO the coolest part of this project to work on is the visualization aspect so you'd probably rather have a little fun with that.
- Daryl will use numpy to extract the frequency and volume from sound files, and do a cubefield thing.
If it turns out that you guys have extra time after you've done your job, try to write another visualizer, improve yours (quality over quantity), or add other features (like interactivity, which we can discuss more later on in the project). We'll pick from the best once we have our stuff together.
If we have time, we might integrate with the SoundCloud API, as done in this visualizer. Or some other API.
Refer to my email to ml7 group about branching if you need a reference for Git branching, or to this.
Please write legitimate, detailed commit messages. If you don't, everyone will hate you.
DO NOT approve a pull request if code is not commented well (we're talking block comments/docstrings/etc everywhere- you should know what every function does) or if the request is not written up well.
If you choose to deny a pull request, be sure to explain why.
Only approve a pull request after actually reviewing all of the changes and making a detailed comment; please don't approve your own pull requests.
There are better workflows we could use, but at this point I think it would be most appropriate to follow the same workflow we did in class (i.e. Daryl would do work in the git branch Daryl (regardless of what I'm working on), etc.). If the project gets larger and we continue working on it, we can switch to a better workflow.
Try to follow these style guides:
http://www.python.org/dev/peps/pep-0008/
http://google-styleguide.googlecode.com/svn/trunk/javascriptguide.xml
http://google-styleguide.googlecode.com/svn/trunk/htmlcssguide.xml
And whatever other style guides there are out there for what you're writing in.