ELK stack Kubernetes Automation Challenge
During a technical assessment I was tasked with automating the deployment a complete scalable ELK stack on Kubernetes (K8s), to support end-to-end monitoring and logging for cloud-ready applications.
The main aspects of the challenge were:
- Configurations decoupled from runtime using ConfigMaps
- Setup readiness and liveness probes
- Setup resource limits and quotas
- Jenkins Job triggered by a webhook
- Automated Tests to ensure the functionality of the stack
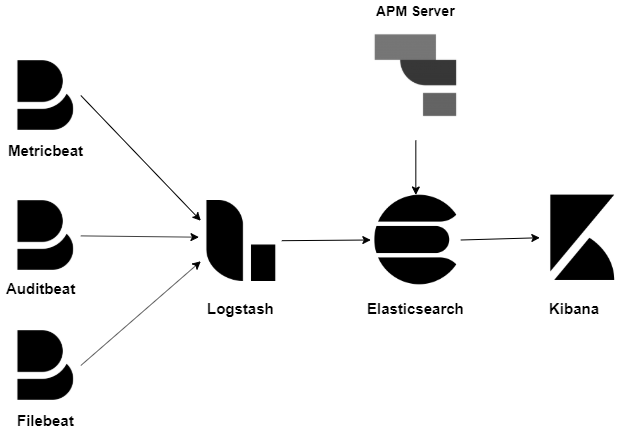
ELK Stack Architecture setup and data flow
The setup was deployed on Google Kubernetes Engine on a standard cluster that was configured to allow autoscaling. The beats components-Metricbeat, Auditbeat and Filebeat- were deployed as Daemonsets to collect metrics and logs from the Kubernetes Cluster nodes and shipping them to Logstash. Logstash was deployed as deployment with a service load-balancing and exposing the beats ingest port and an API port. Logstash was configured with a pipeline to ingest the data from the beats daemons and ship it to Elasticsearch. Elasticsearch is deployed as a StatefulSet with 3 initial replicas ensuring a basic healthy cluster. Kibana interfaces with Elasticsearch to provide visualizations and dashboards.
We bring everything together using Kustomize; it collates and formats all our manifests into one handy, easy to deploy manifest. N.B This is not compulsory but simplifies our work especially when working with a CI/CD pipeline
apiVersion: kustomize.config.k8s.io/v1beta1
kind: Kustomization
resources:
  - setup.yml
  - elasticsearch.yml
  - kibana.yml
  - logstash.yml
  - apm-server.yml
  - beats/metricbeat.yml
  - beats/auditbeat.yml
  - beats/filebeat.yml
This then allows us to deploy using a single manifest.
kubectl kustomize . > compiled.yml
kubectl apply -f compiled.yml