Kudeki, E.; Milla, M.A., "Incoherent Scatter Spectral Theories—Part I: A General Framework and Results for Small Magnetic Aspect Angles," Geoscience and Remote Sensing, IEEE Transactions on , vol.49, no.1, pp.315,328, Jan. 2011
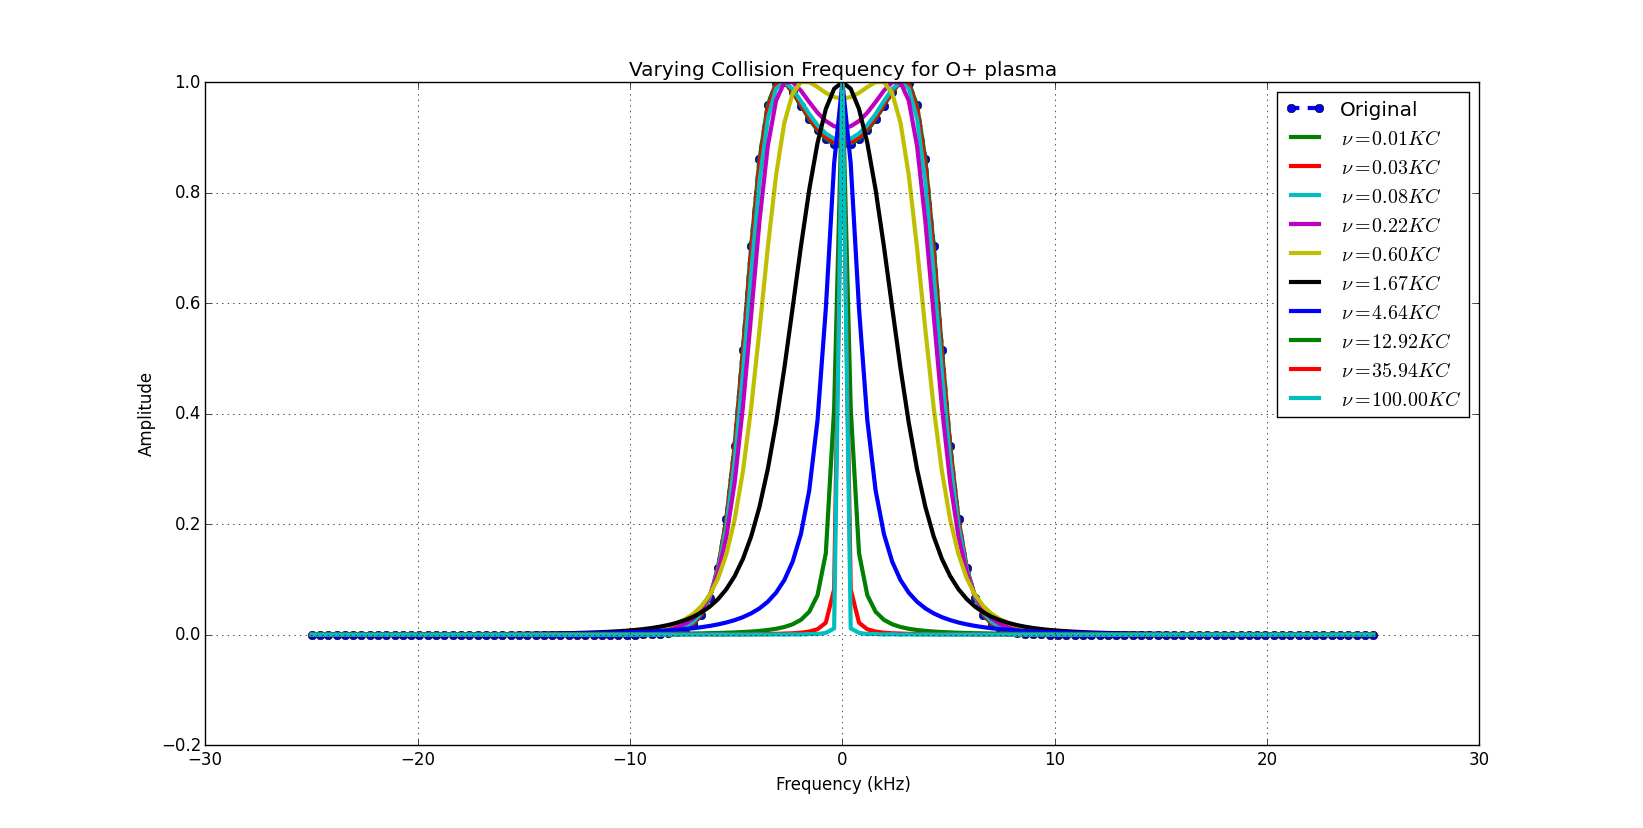
The code has been written to be able to produce a spectrum with an arbitrary number of ion species with an arbitrary collsion frequency and magnetic aspect angle. The only issue is that I will now promise that the code will run quickly at magnetic aspect angles <1 degree perp to B.
This runs on Python 2.7.9. The packages required include
- six
- numpy
- scipy
- pandas
- pytables
- numba
- matplotlib
#Installation
To install first clone repository:
$ git clone https://github.com/jswoboda/ISRSpectrum.git
Then get the submodule housed in the const directory by using the following commands.
$ git submodule init
$ git submodule update
Alternatively one can pass the --recursive option to the intial cloning of the repository.
$ git clone --recursive https://github.com/jswoboda/ISRSpectrum.git
Then move to the main directory and run the Python setup script, which should be run in develop mode.
$ cd ISRSpectrum
$ python setup.py develop
#Code Examples
In order to create the spectrums, assuming the user installed the code, first import the ISRSpectrum class and create an instanstance of the class.
import numpy as np
import ISRSpectrum.ISRSpectrum as ISSnew
from ISRSpectrum.const.physConstants import v_Boltz, v_C_0, v_epsilon0, v_elemcharge, v_me, v_amu

ISS2 = ISSnew.ISRSpectrum(centerFrequency = 440.2*1e6, bMag = 0.4e-4, nspec=129, sampfreq=50e3,dFlag=True)

ti = 1e3
te = 1e3
Ne = 1e11
Ni = 1e11
mi = 16
Ce = np.sqrt(v_Boltz*te/v_me)
Ci = np.sqrt(v_Boltz*ti/(v_amu*mi))

datablock90 = np.array([[Ni,ti,0,1,mi,0],[Ne,te,0,1,1,0]])
(omega,specorig,rcs) = ISS2.getspec(datablock90, rcsflag = True)
Where each colum of the data block is represented as a the information for a ion/electron species. The list is in this order[density(m^-3),tempreture(K), Doppler velocity (m/s),charge in elementary charges, mass of the species in AMU, collision frequency in s^-1]. The info for the elctron species must be the last row also !
Alternatively, if you are only using the following species: O+,NO+,N2+,O2+,N+, H+, e-, a simpler interface is avalible. Using this interface quasi-neutrality is assumed so the number of positive ions and electrons are the same. The user can get spectrum in the following way.
import ISRSpectrum.ISRSpectrum as ISSnew
ISS2 = ISSnew.ISRSpectrum(centerFrequency = 440.2*1e6, bMag = 0.4e-4, nspec=129, sampfreq=50e3,dFlag=True)

ti = 1e3
te = 1e3
Ne = 1e11
Ni = 1e11
vi = 0
species = ['0+','e-']
datablock = np.array([[Ni,ti],[Ne,te]])
(omega,specorig,rcs) = ISS2.getspecsep(datablock,species,vi,90,rcsflag = True)
Further examples can be found in Examples/examplespectrums.py