- Brandon Haynes bhaynes@cs.washington.edu
Perfopticon (Moritz, Halperin, Howe & Heer, 2015) is an interactive profiling tool that provides the ability to view database query performance at two levels of detail. At a high level, a query is displayed as a graph with several globally-scoped metrics overlaid. For example, arrow sizes give an indication of the number of tuples passing between two operators. Perfopticon also includes a rich set of lower-level query details, such as the runtime contribution of each operator and worker execution metrics.
While Perfopticon provides sufficient detail for virtually any query profiling task, for some debugging tasks it can be initially difficult to identify which query fragments and operators are the primary contributors to poor performance. As a result, a typical debugging session involves performing many drill-down operations to identify a relevant set of performance issues. Additionally, because of the static and global nature of the high-level query graph, debugging requires fine-grained review of many execution traces in order to identify more subtle performance issues such as worker skew. When a query is run over many workers, this requires substantial attention to detail and comparison across many plots.
In this project we extend the high-level query graph in Perfopticon to support dynamic visualization of query execution over several metrics relevant to performance debugging. This includes (i) a dynamic display of tuple cardinality between query operators and fragments, (ii) an indication of operators that are "hot spots" with respect to total operator execution time, and (iii) the display of inter-operator data skew over workers. These metrics are displayed in a dynamic manner, allowing a viewer to gain a global perspective of how operators behave and how tuples flow over the entirety of a query. We believe that the addition of these dynamic metrics allow one to quickly identify the most problematic areas of a query and the time during with performance is poor, quickly leading a user to the correct areas in which to consult more finely-detailed Perfopticon dataflow and execution traces.
The Myria database management system leverages Perfopticon as a query visualization tool (via the Myria webserver project). Since this project is a Perfopticon extension, we therefore elected to extend Myria-Web to demonstrate its features.
Accordingly, the installation process requires the following steps:
- Install the Google App Engine SDK for Python
- Clone this repository (
git clone https://github.com/CSE512-15S/a3-haynesb.git) - Update repository submodules (
git submodule initandgit submodule update) - (Optional) Update
appengine/myria_web_main.pyto point to a specific MyriaX engine (default=demo.myria.cs.washington.edu) - Launch the webserver (
dev_appserver.py /path/to/myria-web/appengine) - Execute a query (
http://localhost:8080/editor), making sure to select the profiling option - View query profiling results
A demo of the dynamic query visualization is also available. Some pre-profiled queries:
Nested Cross-Products (53 seconds)
T1 = scan(TwitterK);
T2 = empty(x:int);

T2 = T2 + [from T1,T1 as x emit $0 as x];
T2 = T2 + [from T1,T1 as x emit $0 as x];

store(T2, JustX);
Join Insanity! (3 minutes)
T1 = scan(TwitterK);
T2 = scan(TwitterK);
T3 = scan(TwitterK);
T4 = scan(TwitterK);

Joined = [from T1, T2, T3, T4
          where T1.$1 = T2.$0 and T2.$1 = T3.$0 and T3.$1 = T4.$0
          emit T1.$0 as src,
               T2.$0 as first_link,
               T3.$0 as second_link,
               T4.$0 as third_link,
               T4.$1 as destination];
store(Joined, FourHopsInTwitter);T1 = scan(TwitterK);
T2 = scan(TwitterK);
Joined = [from T1, T2
where T1.$1 = T2.$0
emit T1.$0 as src,
T2.$0 as first_link,
T2.$1 as destination];
store(Joined, TwoHopsInTwitter);There were several dependent (dynamic graph animation, integration with existing Perfopticon framework) and independent (legend, slider, scales) components involved with these projects. We began by identifying the core animation considerations (including tuple cardinality, operator/fragment time, and worker skew) and how these components should be represented, and used this to motivate the overall visualization design.
At a high level, we wished to extend the existing Perfopticon framework to support the following rough features:
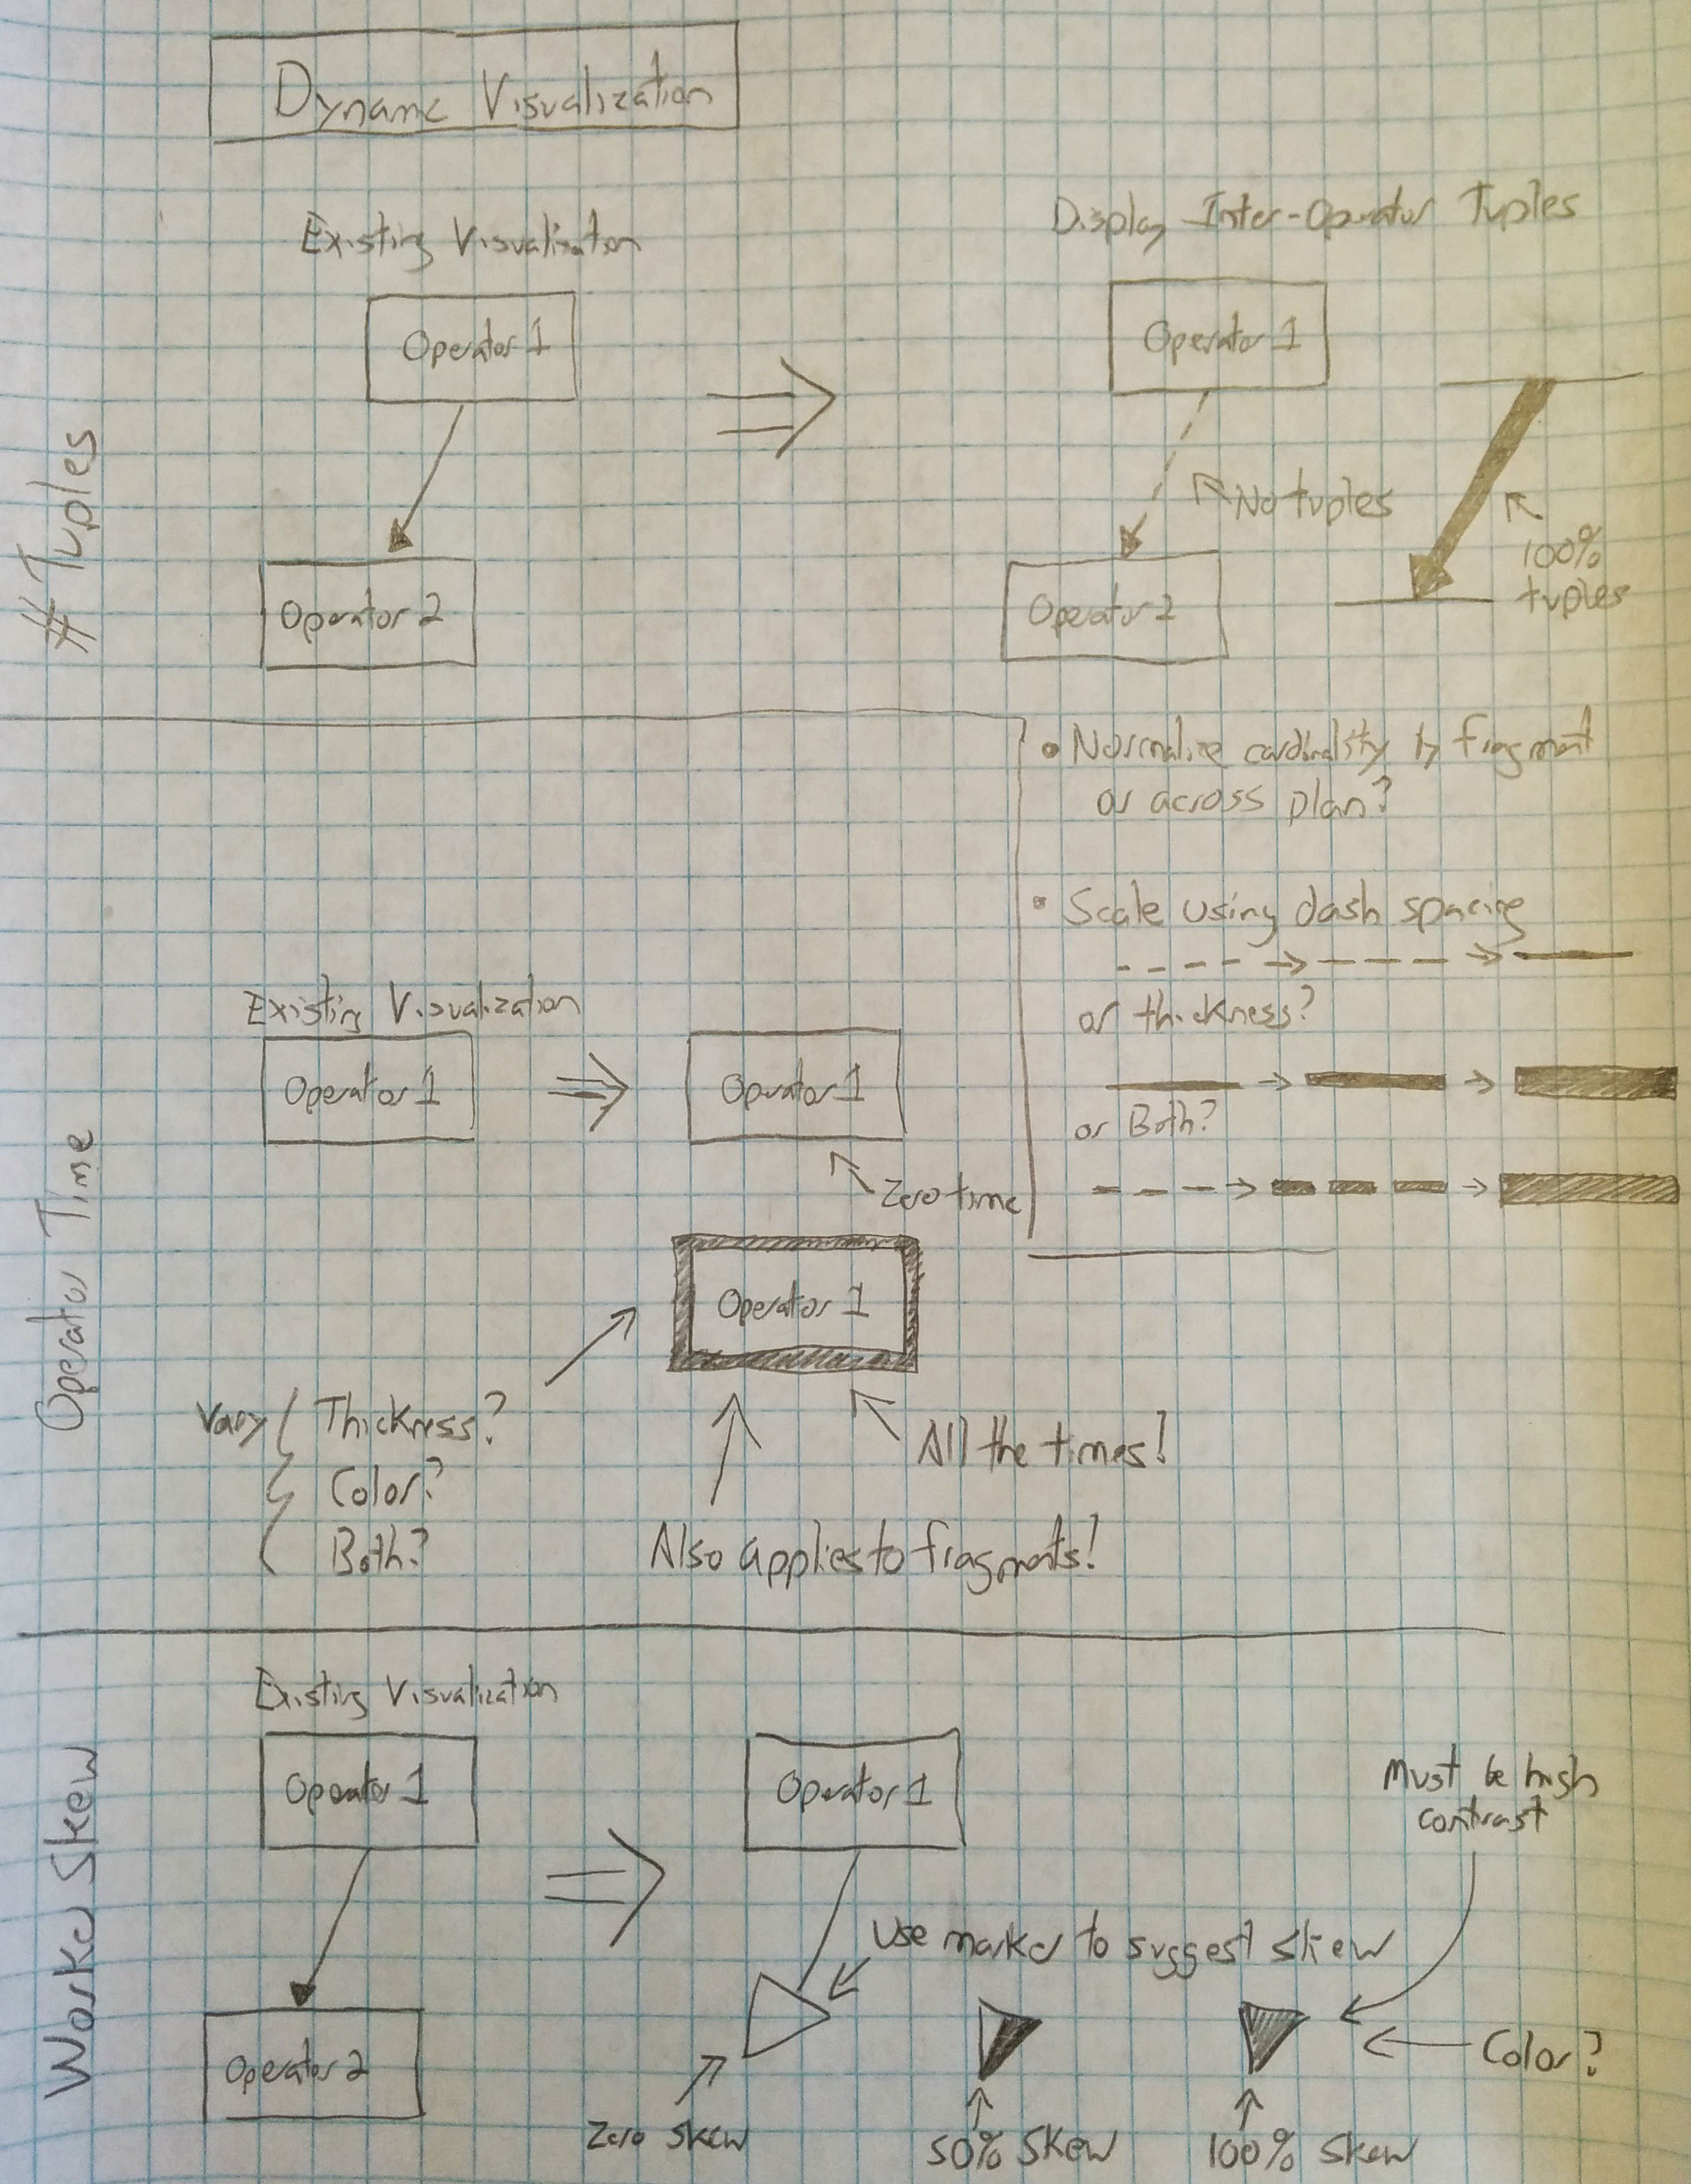
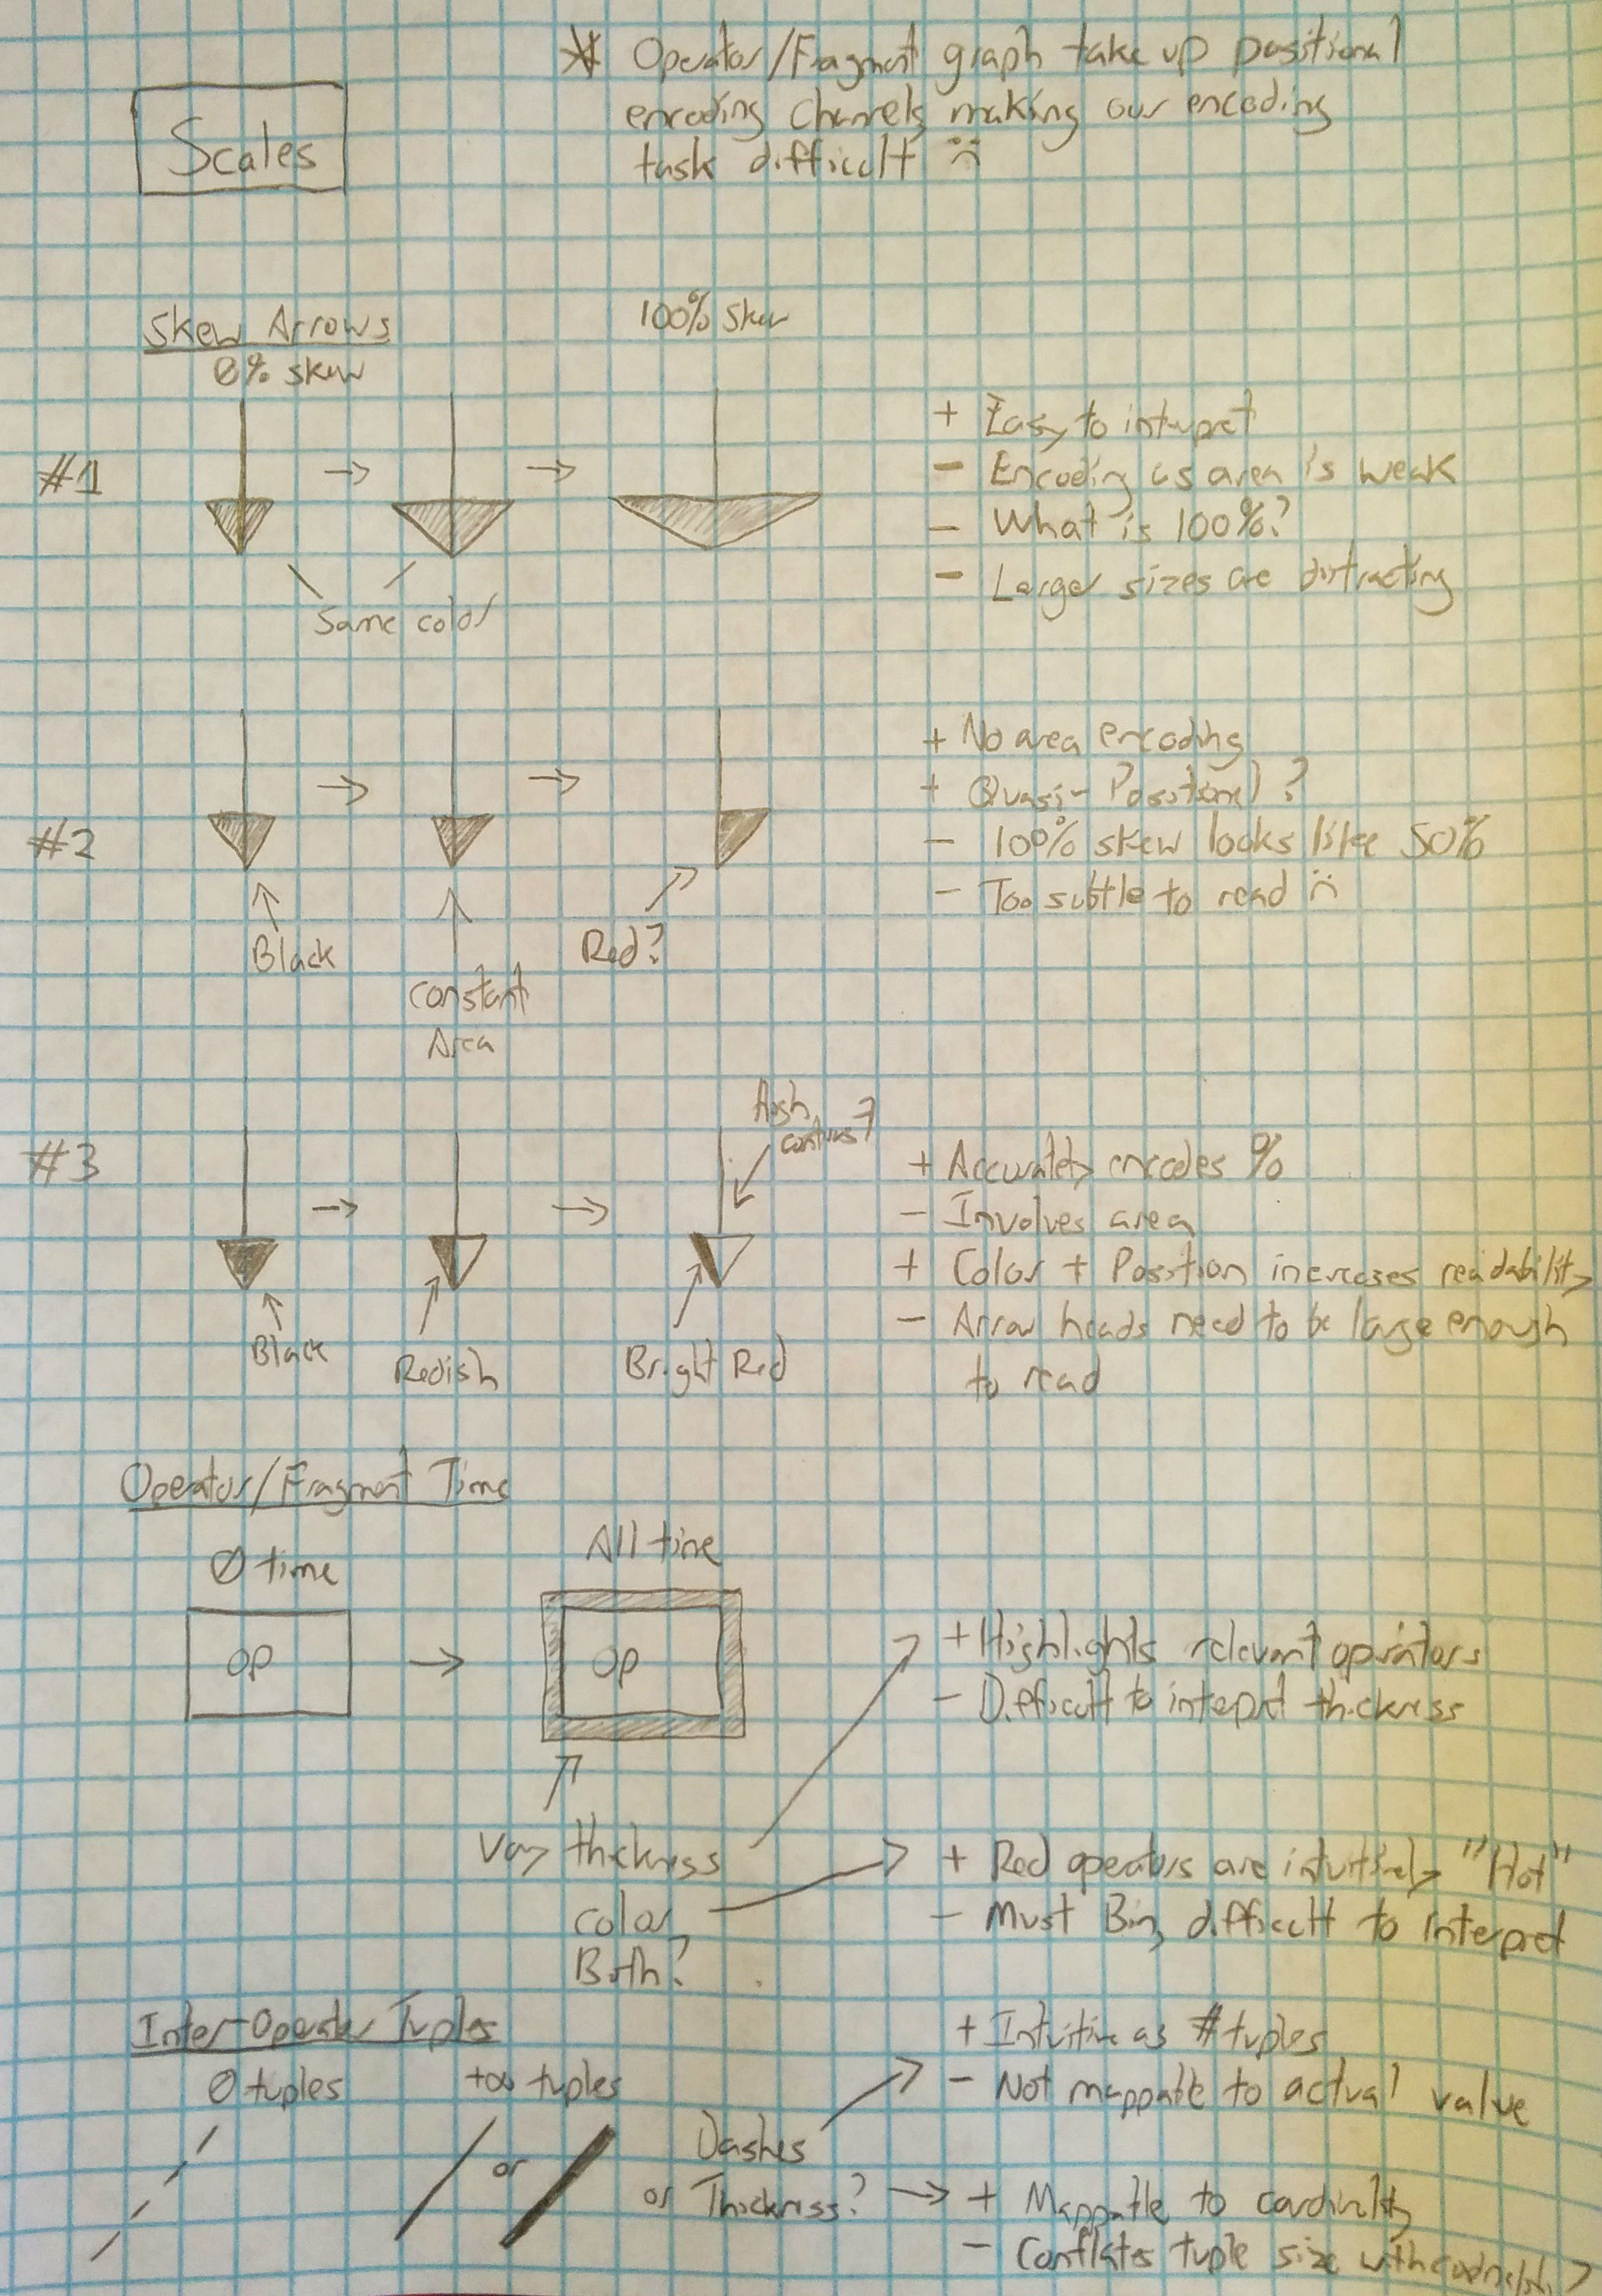
Note that there are several subtle design considerations here. Since the graph layout itself was relatively fixed and eliminated opportunities to use positional dimensions, we were forced to rely on less-optimal encoding choices to communicate our data. Accordingly, once we had identified an initial design, we spent considerable time drilling down into exactly how these features could be represented without altering the existing graph layout. These design choices are illustrated below:
Representing skew turned out to be the most challenging of the features to communicate. Because skew is associated with the links between operators, it cannot be added to the operator vertices themselves. Additionally, because we are already communicating tuple cardinality via line features, adding this dimension as a line characteristic would seriously impact comprehensibility.
Accordingly, we elected to leverage the line markers to communicate worker skew. Because the markers are already directional, associating an implicit skewness is a good design choice; however, the exact manner in which skewness is surfaced remained difficult. We went through several design iterations before settling on our final design, which maintains a constant marker size and illustrates skew by highlighting an increasingly narrow portion of the marker as the skew increases. To further highlight this narrowing, we reduce the lightness of the marker under high-skew conditions to increase the contrast between the narrow highlight and the remainder of the marker. Additionally, we concluded that it was important to maintain a running average of skew to prevent large changes in values.
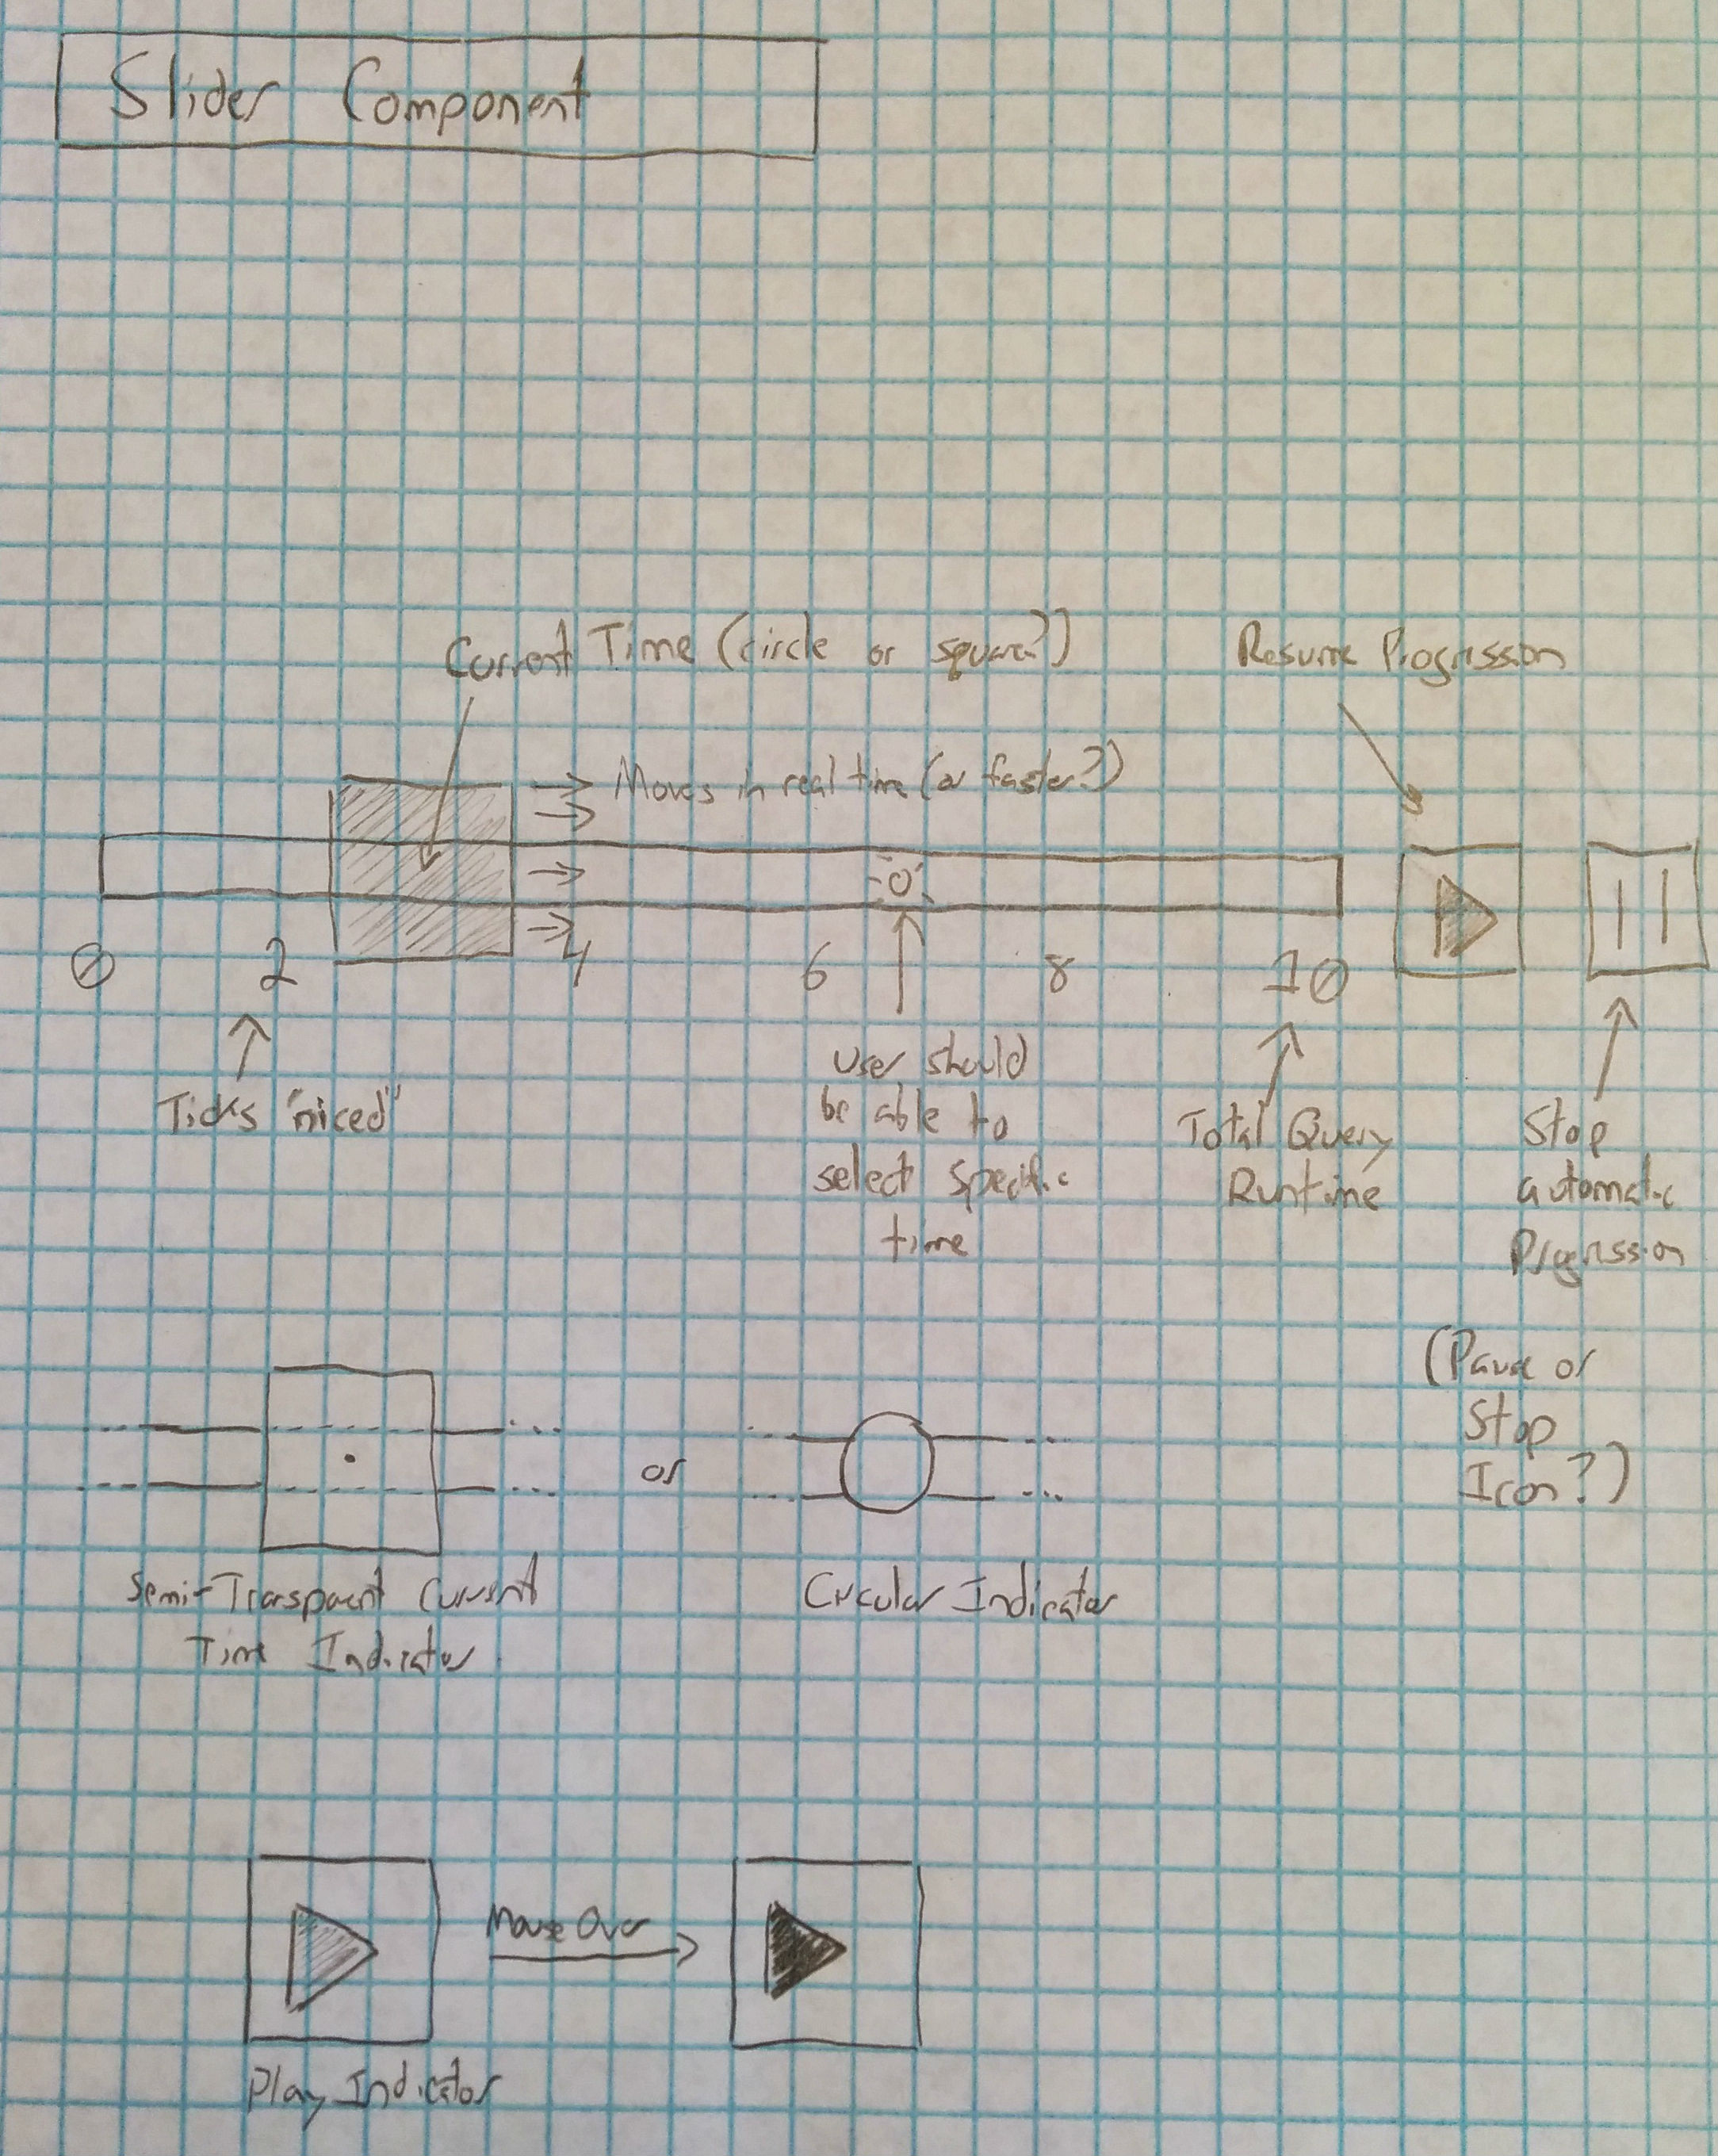
The legend and slider components were relatively independent of the existing Perfopticon design, and we were able to design them in isolation. We needed a slider-like component to illustrate the passage of time during query execution, pause the animation during an interesting time period, and to allow a user to select a specific point in time to view the query. Our draft design captured all of these features in a straightforward manner:
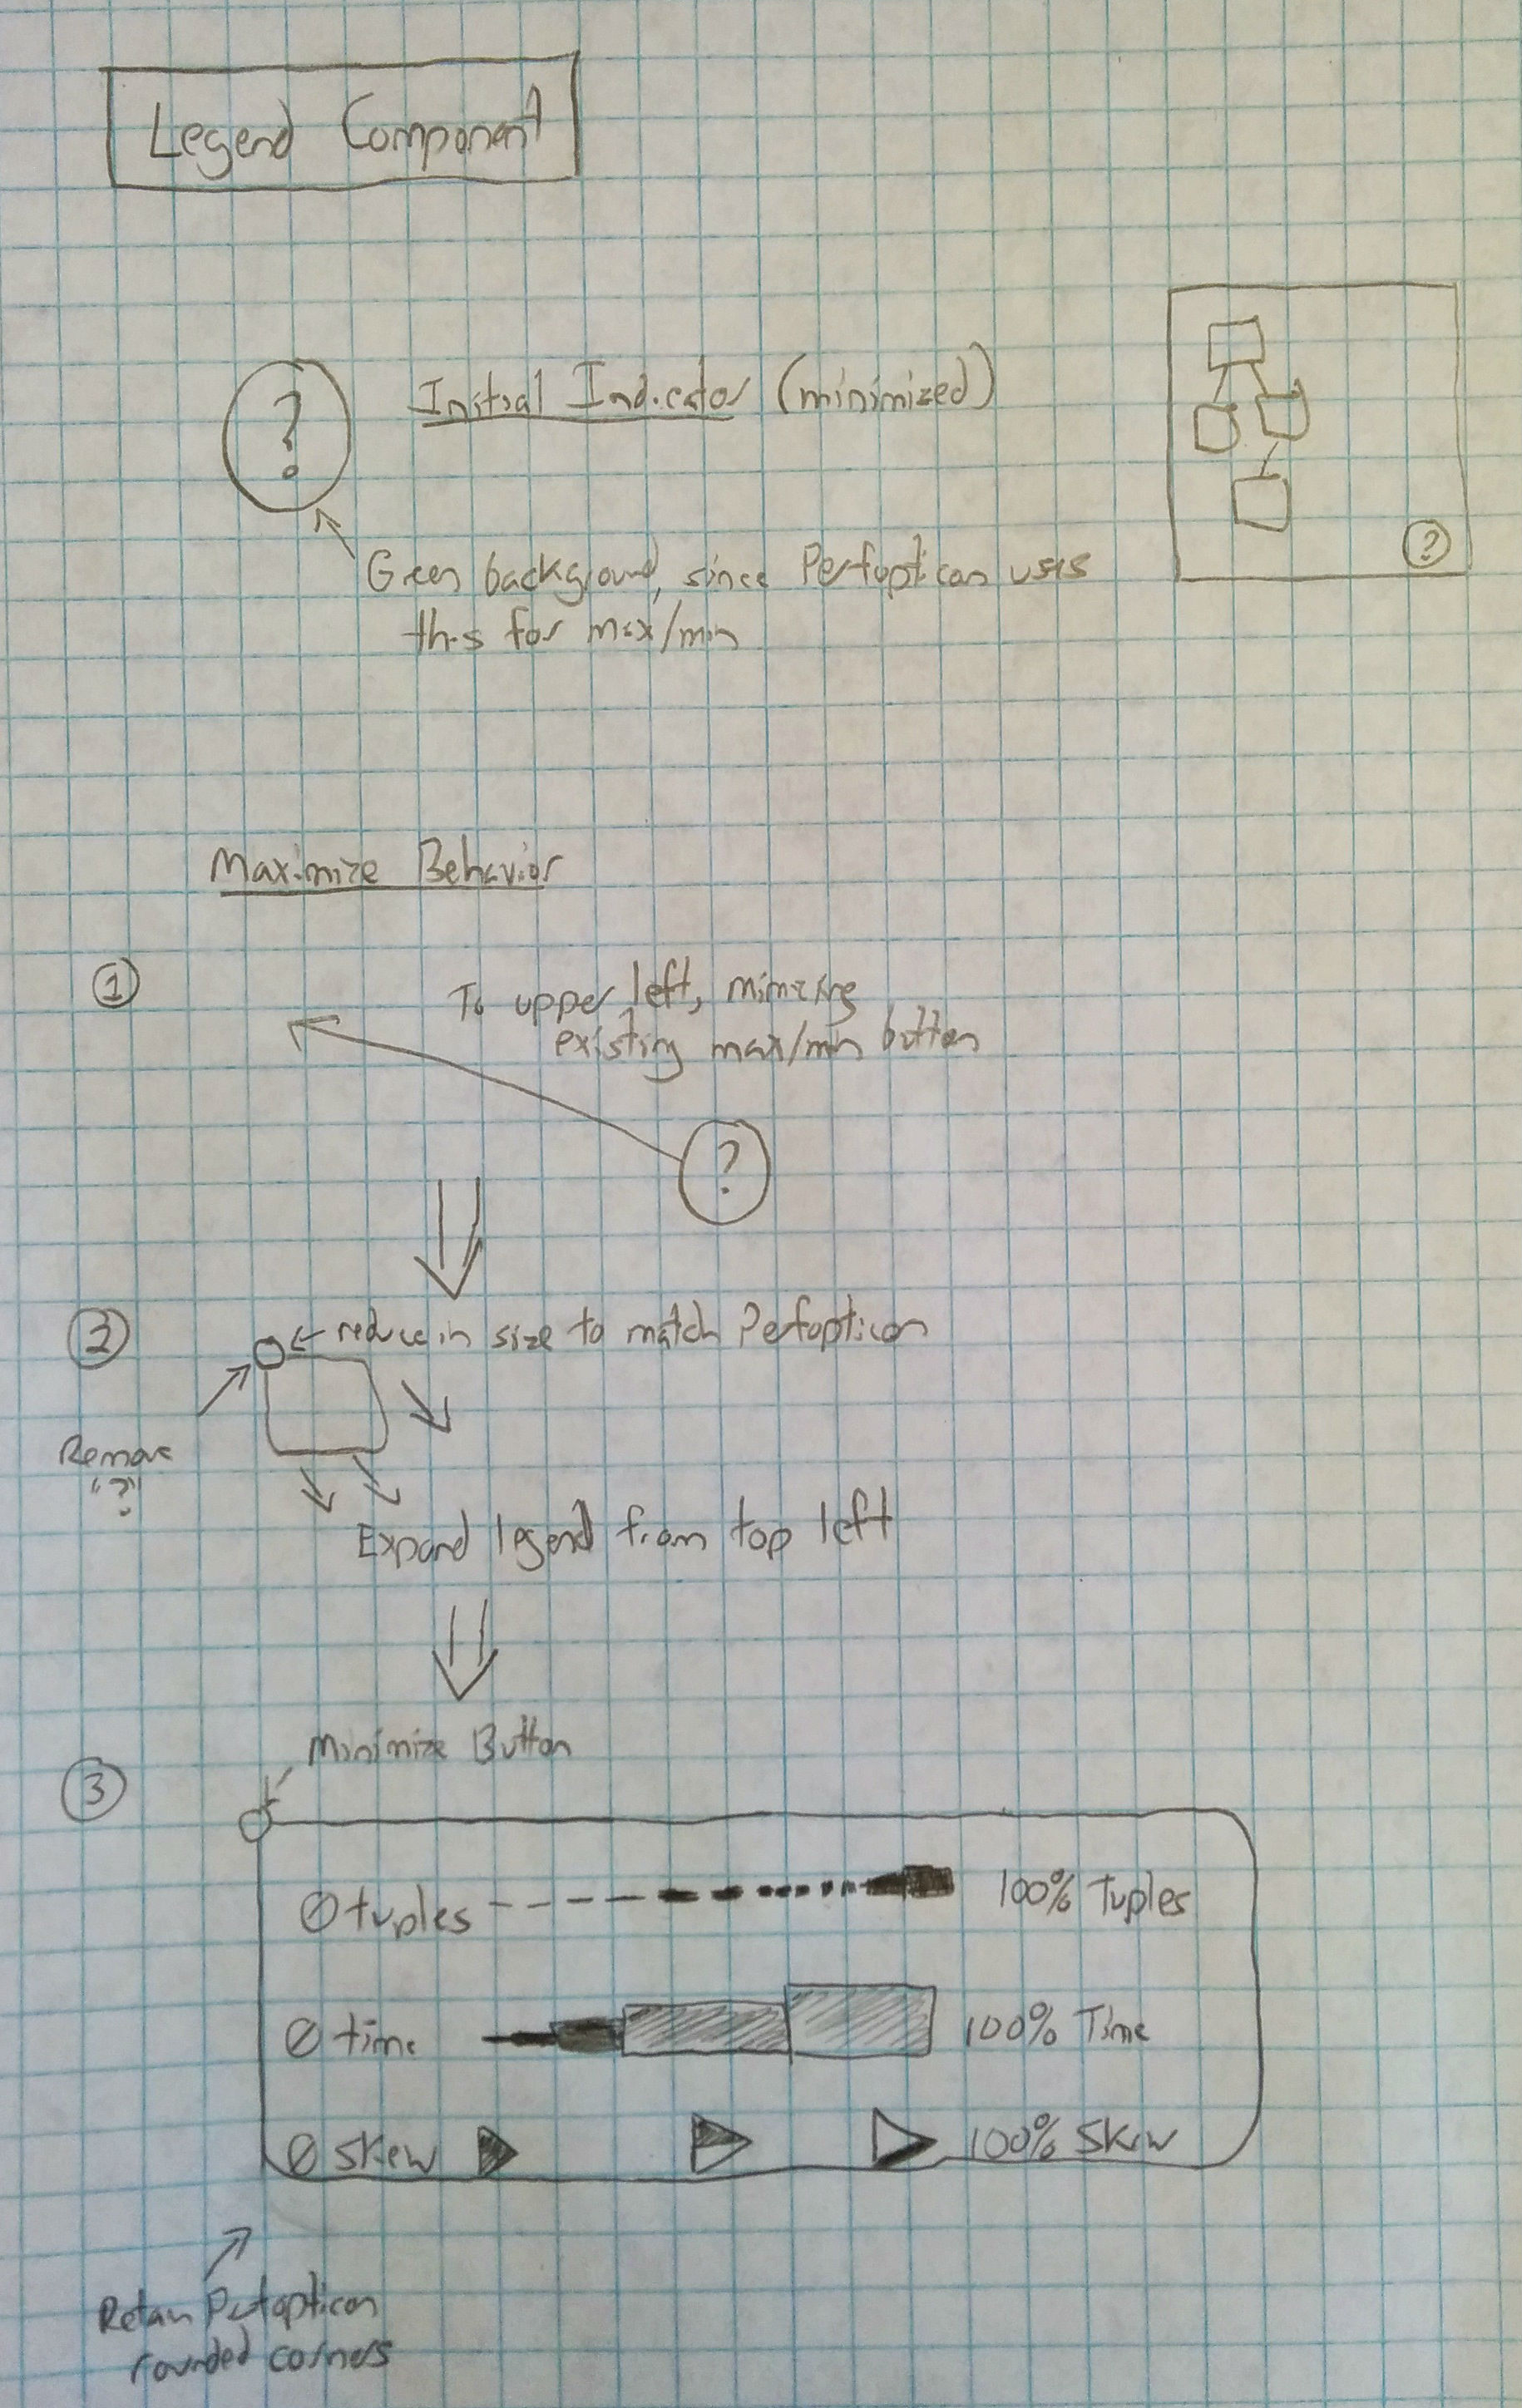
Similarly, the legend component was reasonably straightforward. Insofar as possible we retained the existing Perfopticon design choices. For example, we were able to reuse the fragment maximize/minimize style for the highly-similar legend behavior.
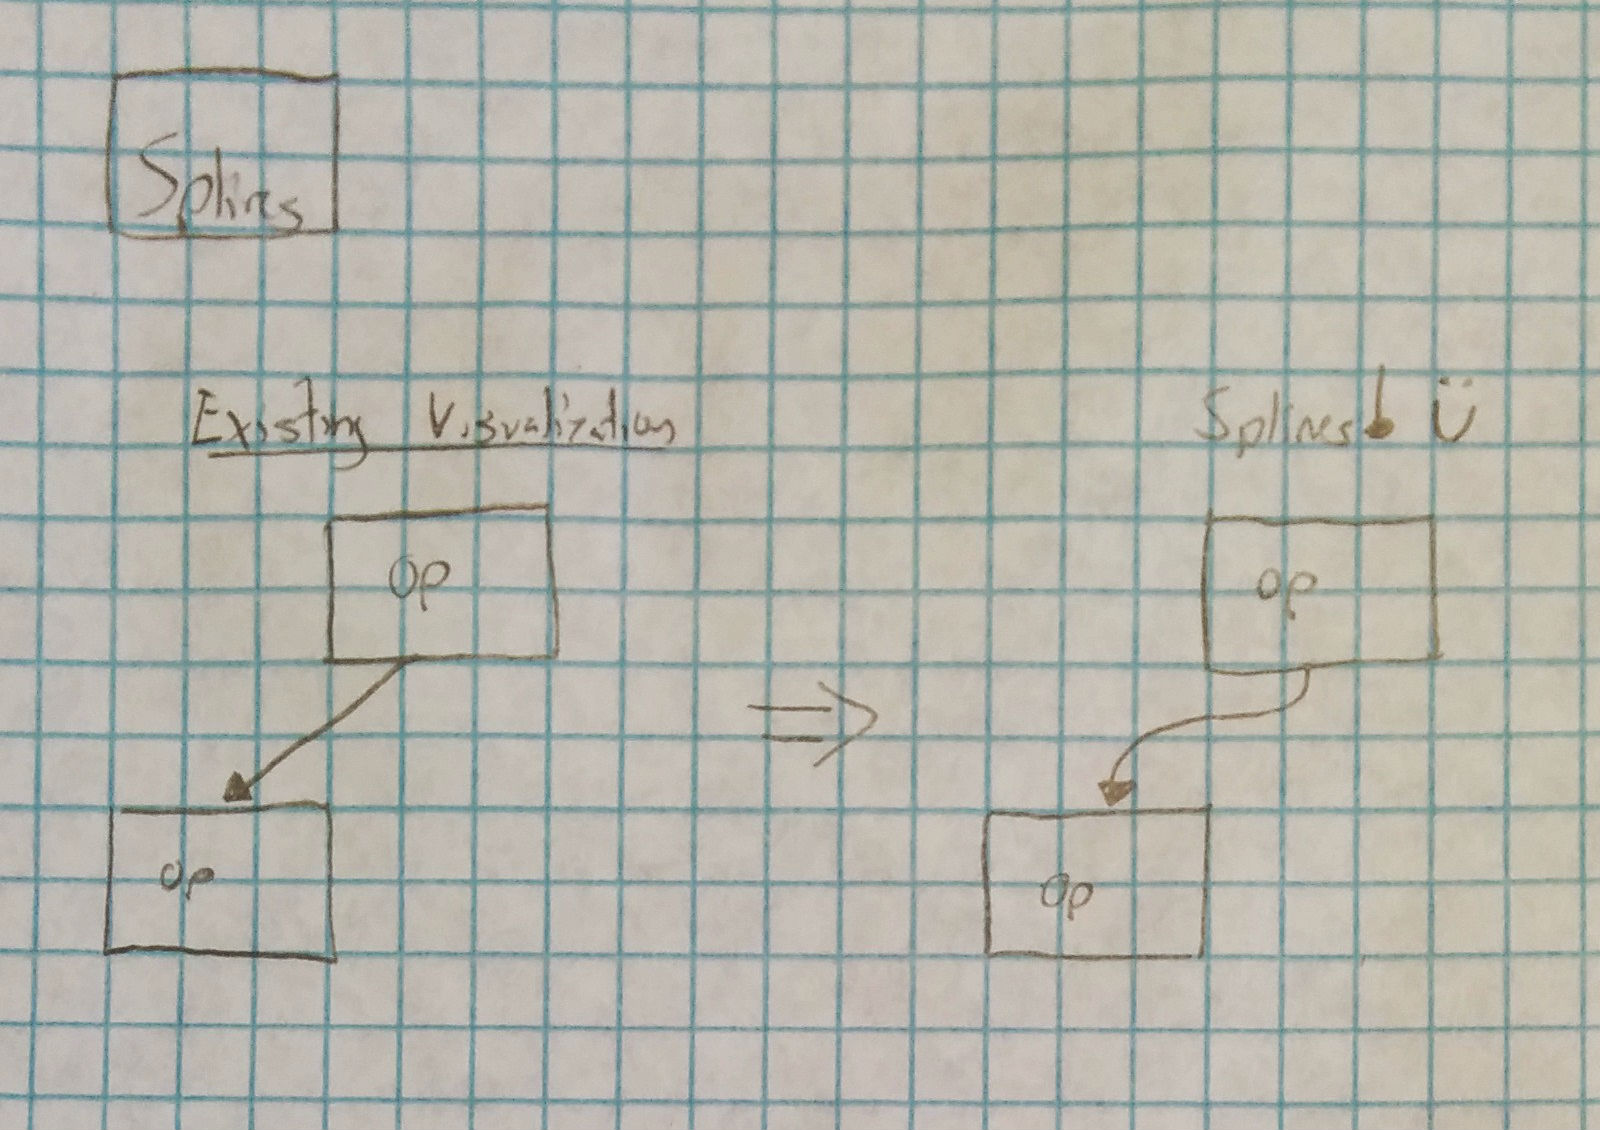
Finally, in its current form Perfopticon uses straight lines to illustrate connections between operators. We found that adding a small amount of curvature made the resulting image more visually pleasing:
The major changes that occurred between the storyboard and implementation process involved identifying the best scales to utilize in the visualization. We ultimately elected to bin the time axis as a series of nine gradated colors, rather using a continuous scale. Similar, we elected to eschew dashed lines for inter-operator tuple cardinality except for the case where |t|=0.
The preponderance of the development effort involved understanding the existing Perfopticon framework and understanding how dynamic visualization features might be best-incorporated without impacting existing features. Total development time was approximately 40 man-hours, with most of the development time being dedicated to understanding the existing framework, becoming familiar with D3, and implementing the graph animation components. Integrating additional D3 features into an existing framework turned out to be particularly challenging, and the most time was spent dealing with the difficulties that resulted.
We were able to isolate the contribution into the following components:
Graph Animation (appengine/js/graphAnimation.js)
This component contains most logic for dynamic query visualization, including D3 update logic for inter-operator tuple cardinality, time spent in operators and fragments, and worker skew visualization. Each of these operators depends on externally-supplied data, which are obtained via the profilingAggregation component below.
Profiling Aggregation (appengine/js/profilingAggregation.js)
This component is responsible for obtaining and aggregating profiling data from an external server. For fetching raw profiling data, the existing Perfopticon URL-formatting logic is used (via templates.urls.profiling), and D3 components are used to obtain CSV data from the resulting REST URL. While the raw data are used for skew calculation, most of the visualization requires aggregated data (e.g., total tuples transmitted between operators per time unit); accordingly, this component exposes operations to aggregate these data as well. Finally, to prevent repeated (and potentially high-latency) REST requests, data are cached so that only one server request is required per time unit and fragment.
Slider (appengine/js/slider.js)
The slider is responsible for maintaining a "current time" in the dynamic visualization, displaying a slider component to indicate passage of time, exposing play/pause buttons for the transition, and allowing a user to select a specific point in time.
Legend (appengine/js/legend.js)
This component is responsible for display and manipulation of the legend component, which visually indicates the relative magnitude of the dynamic visualization components (inter-operator tuples, worker skew, etc.). The legend is semi-transparent, but becomes opaque on mouse-over. It may be moved to any part of the display, and minimized when not needed.
Execution HTML (appengine/templates/execution.html)
In order to illustrate the extension in isolation, we created a dedicated "query execution" webpage that displays the dynamic visualization. While there is no reason that the detailed view may not be displayed alongside the high-level overview (as it is with vanilla Perfopticon), we wanted to avoid the impression that the detailed view was a main contribution of the extension.
Perfopticon Graph Modifications (appengine/js/graph.js)
In order to extend Perfopticon to support dynamic high-level query visualizations, a number of minor adjustments were required in the existing graph visualization component. The most important of these involved exposing a callback that is executed when the graph has completed the load/construction process. Since the extension depends on an already-constructed graph, it leverages this callback to begin the dynamic process after the existing graph has been constructed.
Other less important modifications to this component involves increasing spacing between operators, accounting for the height of the slider component when setting an initial scale, and similar. Finally, splines were added to the inter-operator connections which (in our opinion) were more visually pleasing.
Bostock, M., Ogievetsky, V., & Heer, J. (2011). D³ data-driven documents. Visualization and Computer Graphics, IEEE Transactions on, 17(12), 2301-2309.
Moritz, D., Halperin, D., Howe, B., & Heer, J. (2015). Perfopticon: Visual Query Analysis for Distributed Databases. In Computer Graphics Forum (EuroVis), Cagliari, Italy (Vol. 34).