A python package which can read CINRAD radar data, perform calculations and visualize the data.
Python 3.5 +
Cartopy
Metpy
Shapefile
Pyresample
You can directly install this module via
pip install cinrad
Alternatively, you can download from github page and then excecute
python setup.py install
This submodule contains data structure used in this program.
Radial type data: cinrad.datastruct.Radial
Cross-section type data: cinrad.datastruct._Slice
Grid type data: cinrad.datastruct.Grid
Decode CINRAD radar data.
Simple demonstration:
from cinrad.io import CinradReader, StandardData
f = CinradReader(your_radar_file) #Old version data
f = StandardData(your_radar_file) #New standard data
f.get_data(tilt, drange, dtype) #Get data
f.rhi(azimuth, drange) #Get range-height indicator dataf.to_nc(path_to_nc_file)cinrad.io.PUP provides functions to decode PUP data. The extracted data can be further used to create PPI. (Only radial data are supported.)
from cinrad.io import PUP
f = PUP(your_radar_file)
data = f.get_data()This submodule provides some useful algorithms in radar meteorology. All functions contained only accept numpy.ndarray. This submodule extends the usage of this program, as these functions can accept customized data rather than only the data decoded by cinrad.io.
For directly computation of decoded data, cinrad.easycalc provides functions that simplify the process of calculation. For functions contained in this submodule, only a list of reflectivity data is required as the argument.
Code to generate the required list:
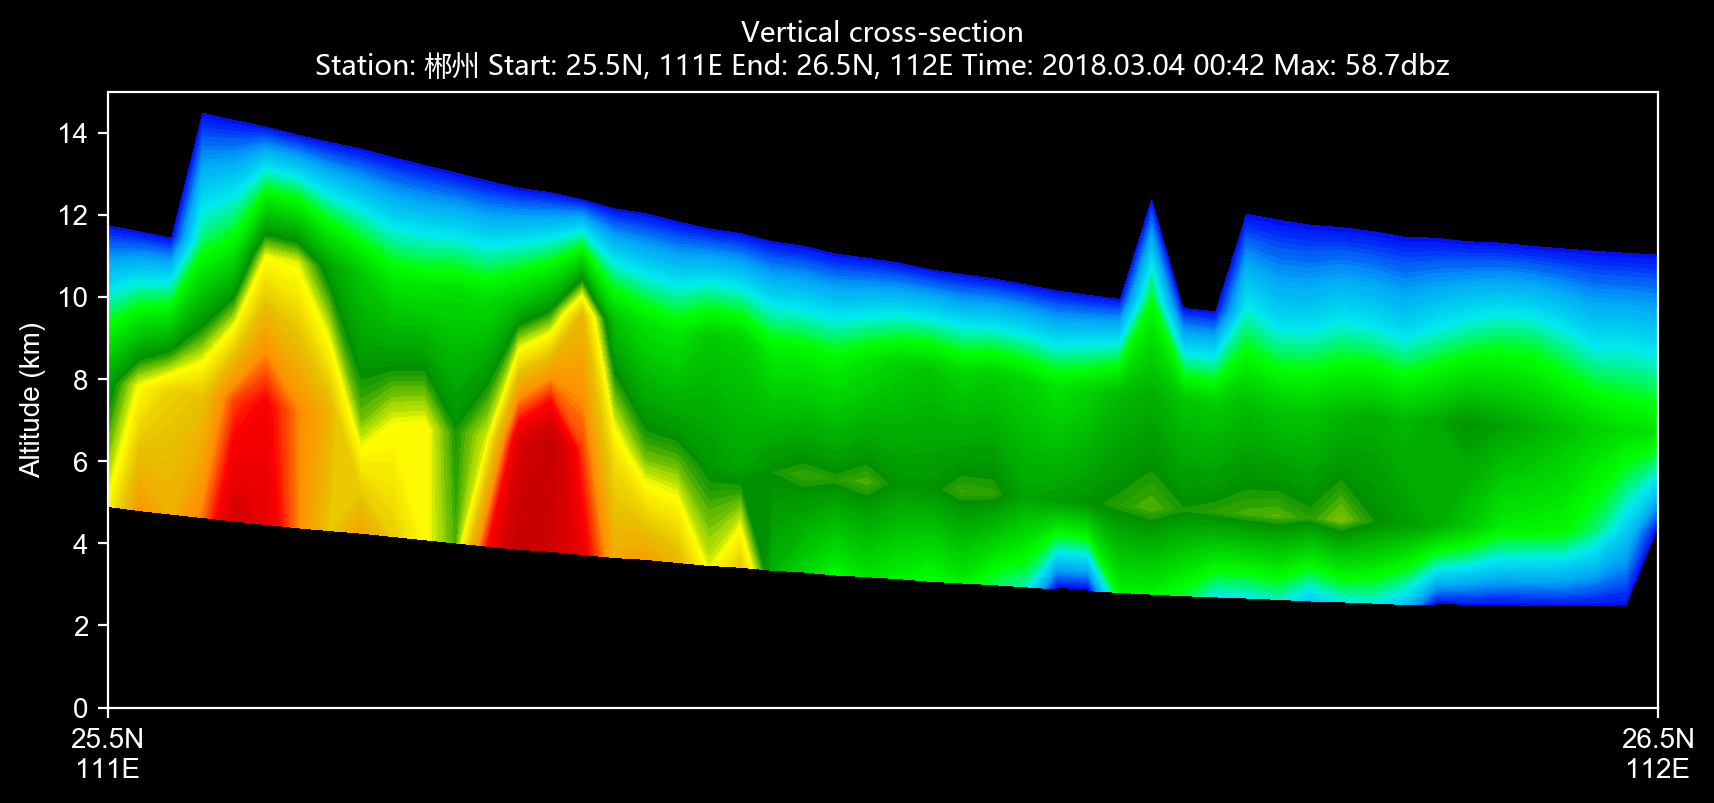
r_list = [f.get_data(i, 230, 'REF') for i in f.angleindex_r]cinrad.easycalc.VCS provides calculation of vertical cross-section.
Sample code
import cinrad
from cinrad.visualize import Section
f = cinrad.io.CinradReader(your_radar_file)
rl = [f.get_data(i, 230, 'REF') for i in f.angleindex_r]
vcs = cinrad.easycalc.VCS(rl)
sec = vcs.get_section(start_cart=(111, 25.5), end_cart=(112, 26.7)) # pass geographic coordinates (latitude, longitude)
sec = vcs.get_section(start_polar=(115, 350), end_polar=(130, 30)) # pass polar coordinates (distance, azimuth)
fig = Section(sec)
fig('D:\\')Visualize the data stored in acceptable format (cinrad.datastruct). It also means that you can using customized data to construct a object belongs to one of the class in cinrad.datastruct and then perform visualization. For further information about this method, please see the examples contained in example folder.
Simple demonstration:
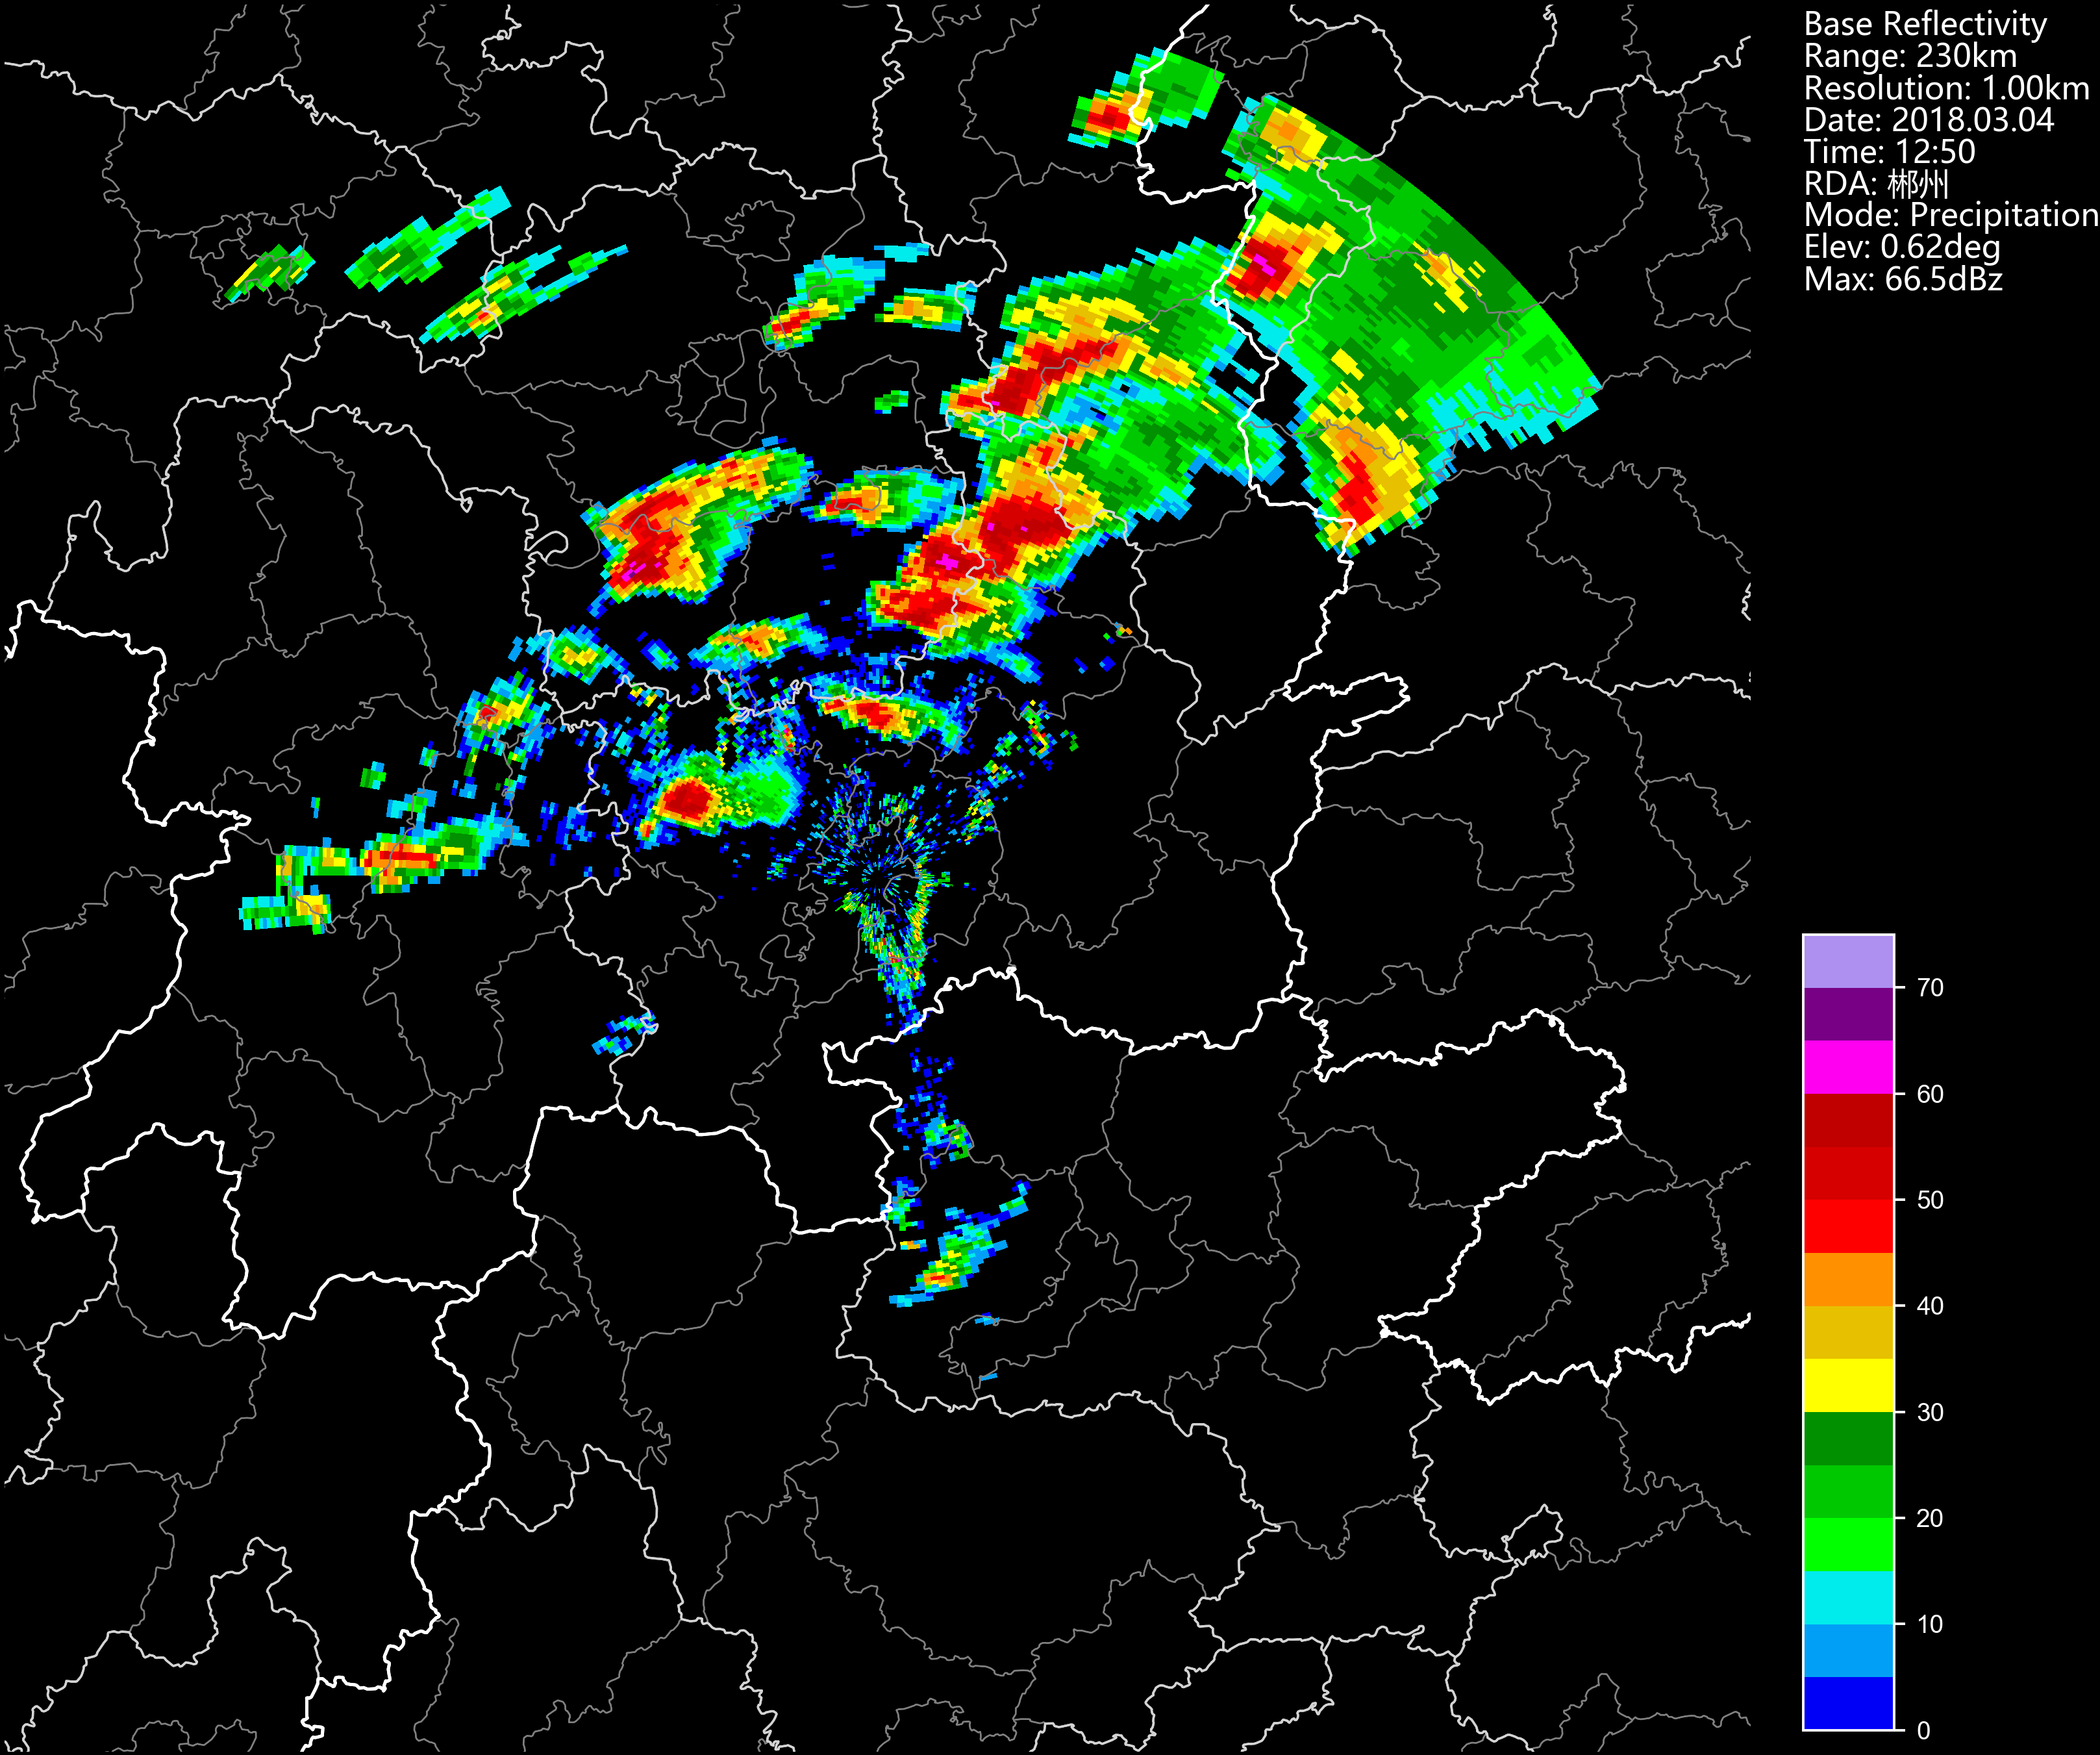
from cinrad.visualize import PPI
fig = PPI(R) #Plot PPI
fig('D:\\') #Pass the path to save the fig
from cinrad.visualize import Section
fig = Section(_Slice) #Plot RHI
fig('D:\\')
The path passed into the class can either be the folder path or the file path. Also, if no path is passed, the figure will be saved at the folder named PyCINRAD in the home folder (e.g. C:\Users\tom).
The summary of args that can be passed into PPI are listed as follows.
| arg | function |
|---|---|
cmap |
colormaps used for plotting |
norm |
norm used for plotting |
nlabel |
number of labels on the colorbar |
label |
labels on the colorbar |
highlight |
highlight area of input name |
dpi |
dpi of figure |
extent |
area to plot e.g. extent=[90, 91, 29, 30] |
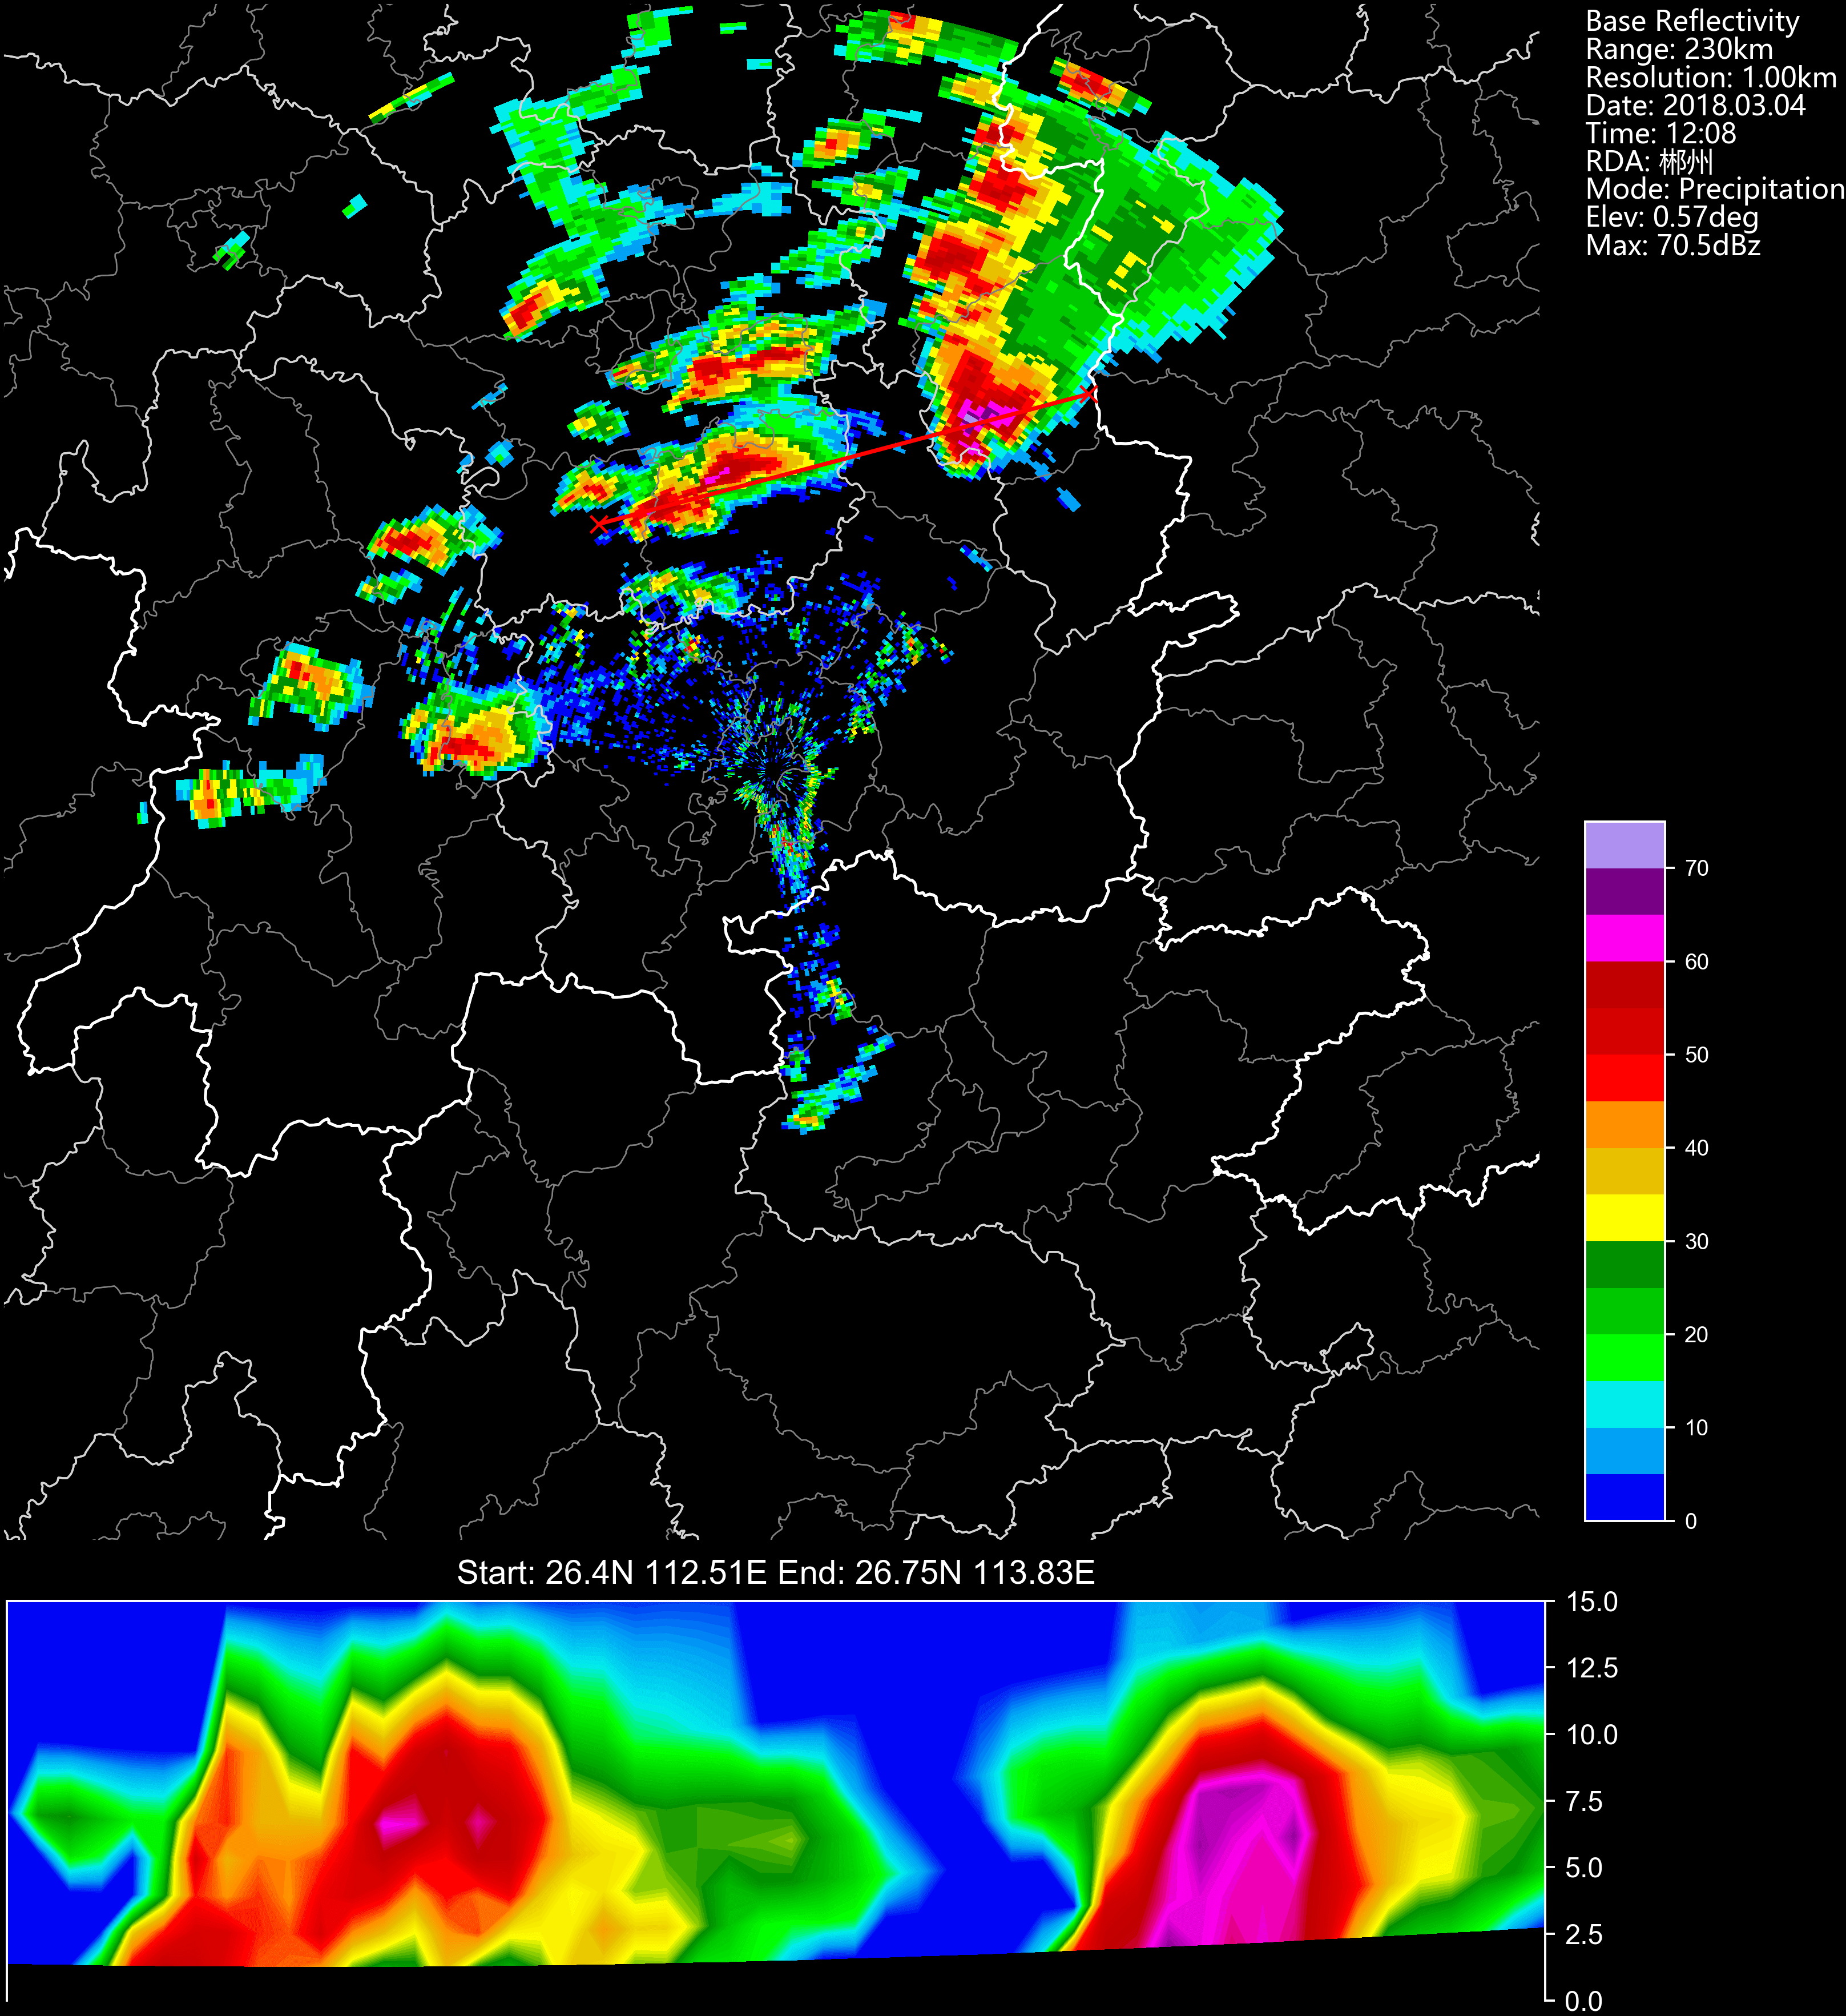
add_slice |
add cross-section data to ppi plot |
style |
control the background color black or white |
Besides args, class PPI has some other auxiliary plotting functions.
Plot range rings on the PPI plot.
Plot VCS section under the PPI plot.
This function is very similar to vcs argument of PPI, but the range of y-axis can be adjusted only by this function.
If you are interested in this program, you can join the developers of this program. Any contribution is appreciated!
If you have some questions or advise about this program, you can create a issue or email me at 274555447@qq.com.