Maiguilles is an arduino-oriented software, in which we can use a cheap 8-bit microcontroller as an oscilloscope or function generator. For now, it is only possible to work with digital signal. We hope that, in the near future, we will also be able to work with analog signal. It was written in python 2.7, powered by qt4, so it could run on any operating system that supports qt4. Development has already reached support for Linux and Windows.
-
Linux: Its needs all the python files in the marster Directory and also requires some other depedencies:
- Python libs:
- Arduino IDE
- Arduino Makefile
-
Windows: Its needs all the python files in the marster Directory and also requires some other depedencies:
- Python libs:
- Arduino IDE
Just type python Maiguilles.py in the .py files folder or Execute the binary file. Note that you need python 2.7 to execute from the Maiguilles.py file.
On the first run, the config program screen will pop up asking the board are you using and the Arduino Makefile location in Linux and Arduino IDE location in Windows. The arduino makefile location normally is located at /usr/share/arduino/ if installed trought package manager. Just point to where the .mk file is and press OK. 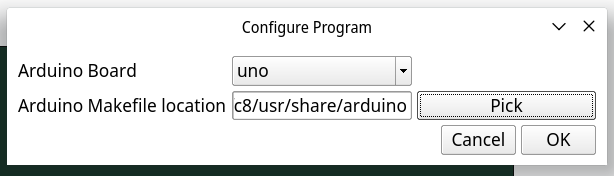 The Arduino IDE location is normaly located ate C:\Program Files (x86)\arduino. Just point to where arduino.exe and arduino_debug.exe are located.
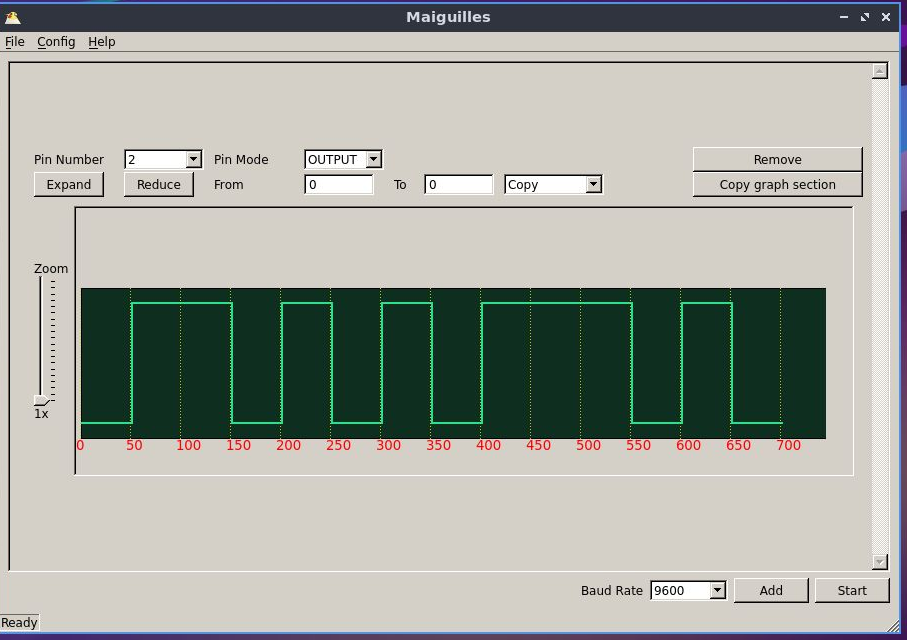
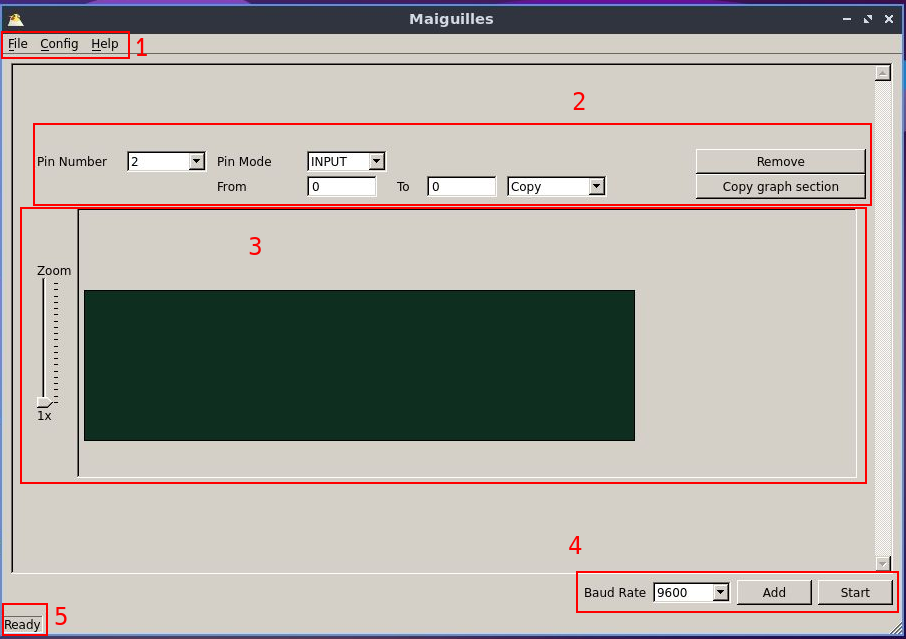 The main screen: This is the software main screen where we can found the following components:
- Menu toolbar:
- File: We can save and open projects in the file tab i.e, we can load previous waveforms or save current waveform for future works. We can exports the waveform to ino file.
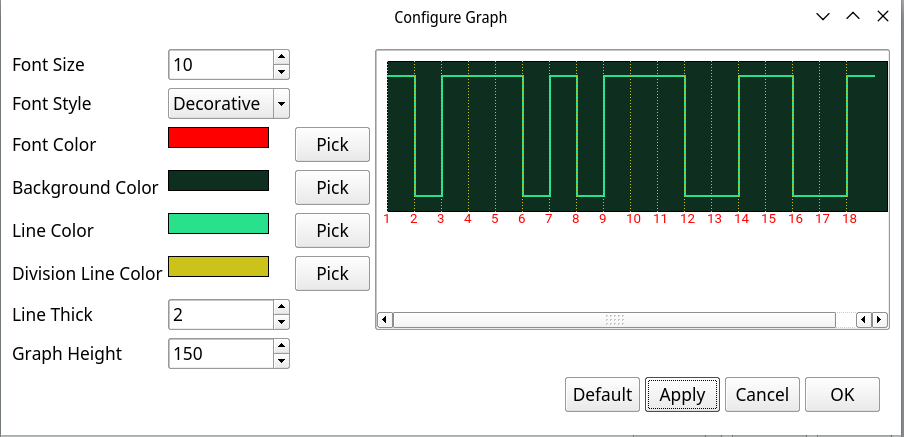
- Config: We can change the graphics colors and style and also change the arduino board or arduino makefile location.
- Help: We can check informations about the software.
- Pin control:
- Pin Numb: Select which arduino pin will be used.
- Pin Mode: We can use the output mode to generate digital waveforms and the input mode to get a digital waveform.
- Expand: Only in output mode, increase the output waveform size.
- Reduce: Only in output mode, decrease the output waveform size.
- remove: Remove the pin usage.
- Operation: Do some kind of operation in the section defined in the interval specified by the user in from X to Y. The operation are:
- Copy: Copy the specified section.
- Delete: Delete the specified section shrink the waveform.
- Negate: Turn zeros into ones and ones into zeros.
- All 1: Turn all zeros in section into ones
- All 0: Turn all ones in section into zeros
- Reverse: Mirrors the waveform
- Paste in: Insert what was copied into the interval
- Substitute: Substitute the interval with what was copied
- Interacting with graphs
- Zoom: Multiple the interval between ticks by the zoom factor
- Graph: Click anywhere between ticks to inverse interval value. It's only for ouput mode
- Zoom: Multiple the interval between ticks by the zoom factor
- Select the baudrate for serial communication, Add new for use and Start to compile and upload the generated ino file to arduino.
- Status bar: Indicates the process status.
- Ready: Everything is alright just needs to press the start button.
- Config program file not found: There is no configProgramFile in the current directory. Go to configs to generate an config file.
- No arduino connected: The software can't find any arduino connected.
- Compiling: The command make is going to be used to compile the generated ino file.
- Uploading: The command make upload is going to be used to upload the compiled ino file into arduino.
- Running: The ino files was already sucessefully uploaded. If the pin mode is output then you can close the software and use the waveform generator as you please. If the pin mode is input you need to press the stop button to drawning the grapgics.
- Drawing Graphics: The waveform obtained by arduino is now been drawing.
- Menu toolbar:
Simply draw the waveform you want by clicking in the intervals between ticks. You can use zoom to increase the ticks intervals and can also expand the waveform length by clicking in expand. When you are done with the waveform just press start. As an example, we drawed this waveform:
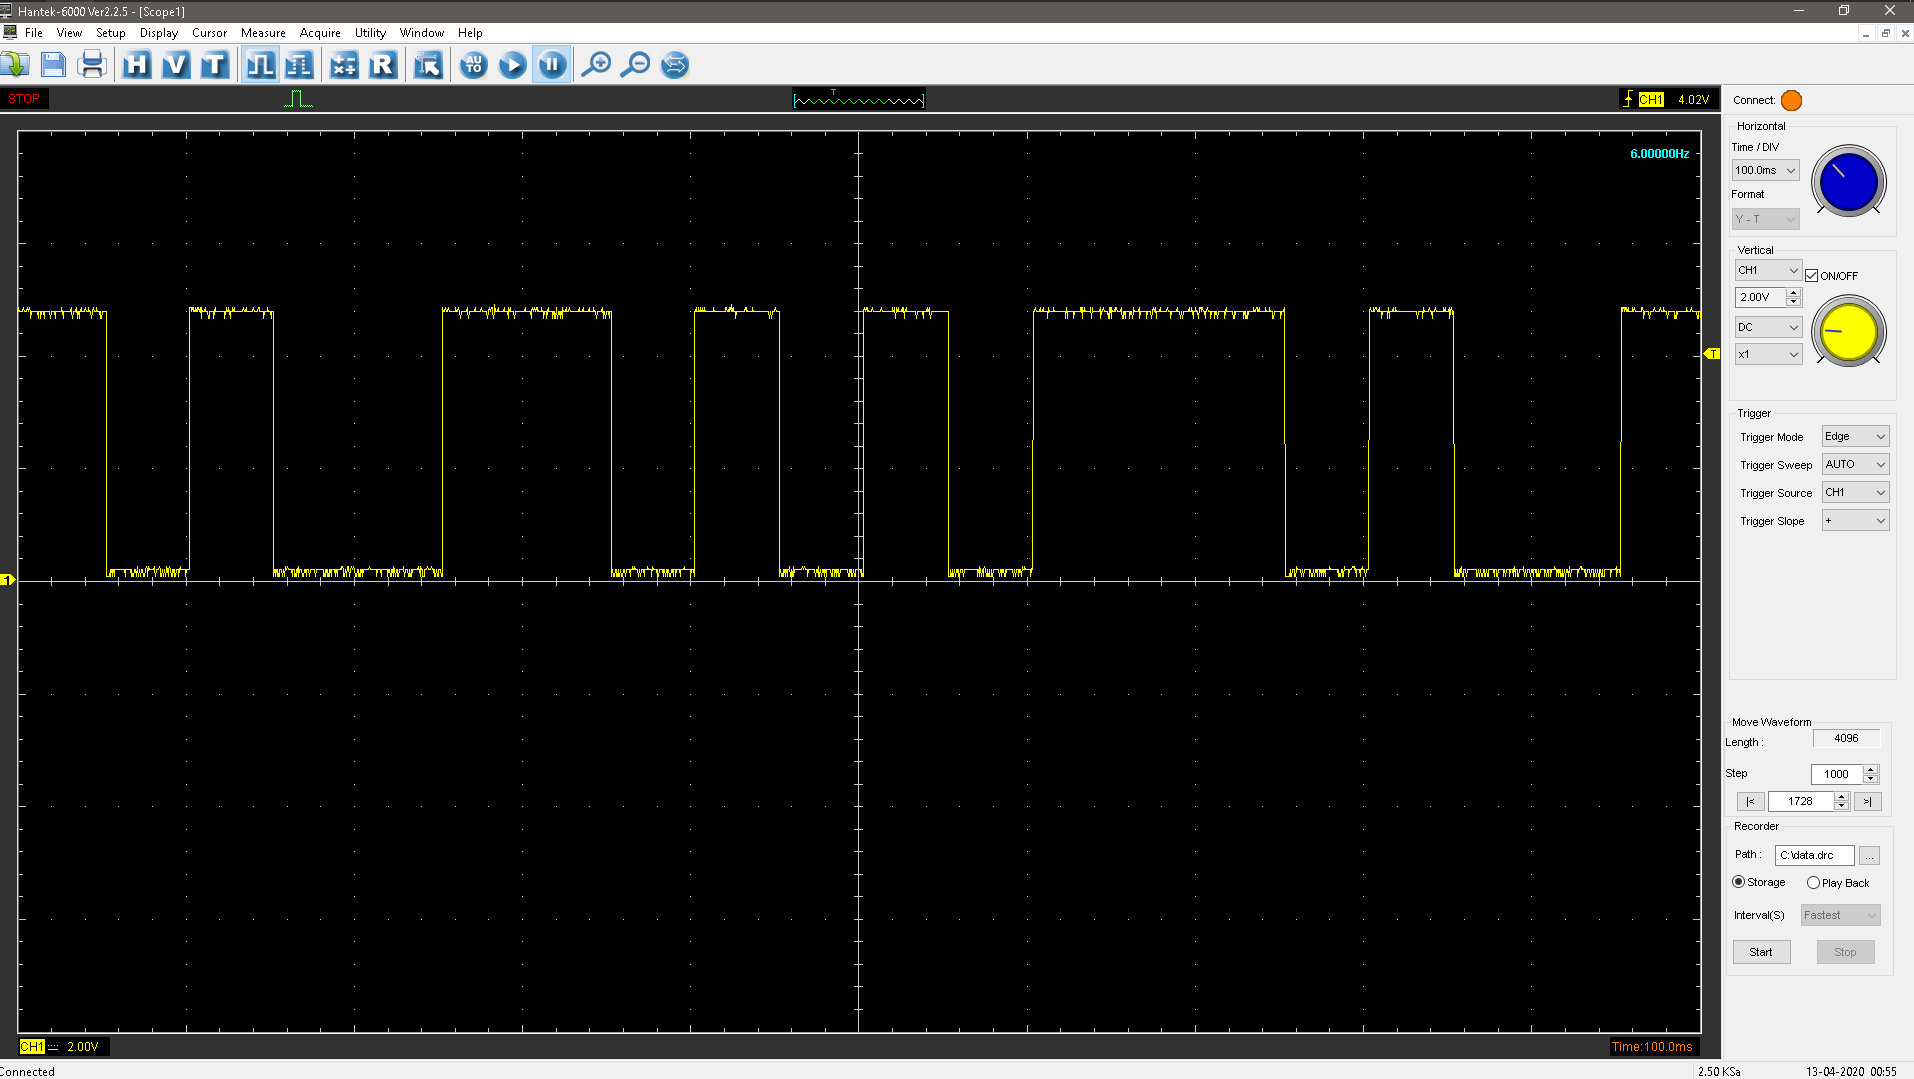
 And then connected the arduino pin 2 to an oscilloscope as the images below shows.
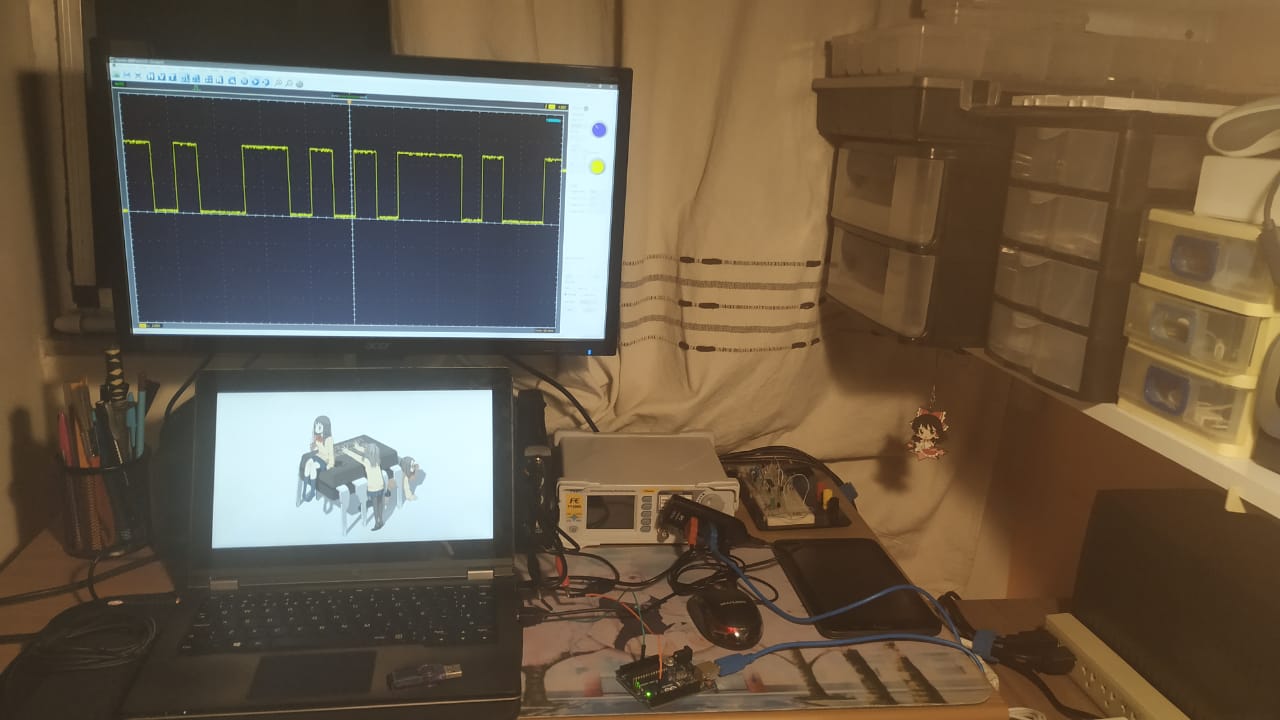 It's works just fine, and as we can see the interval between ticks are in the order of milliseconds.
Simply press start and then press stop when you want to stop recording the signal. After that, the software will draw the graphs. In a close future, the drawing will be in real time. As an example we connected the arduino pin 2 to a Waveform generator.
.jpeg) The waveform generator is given this signal
The waveform generator is given this signal
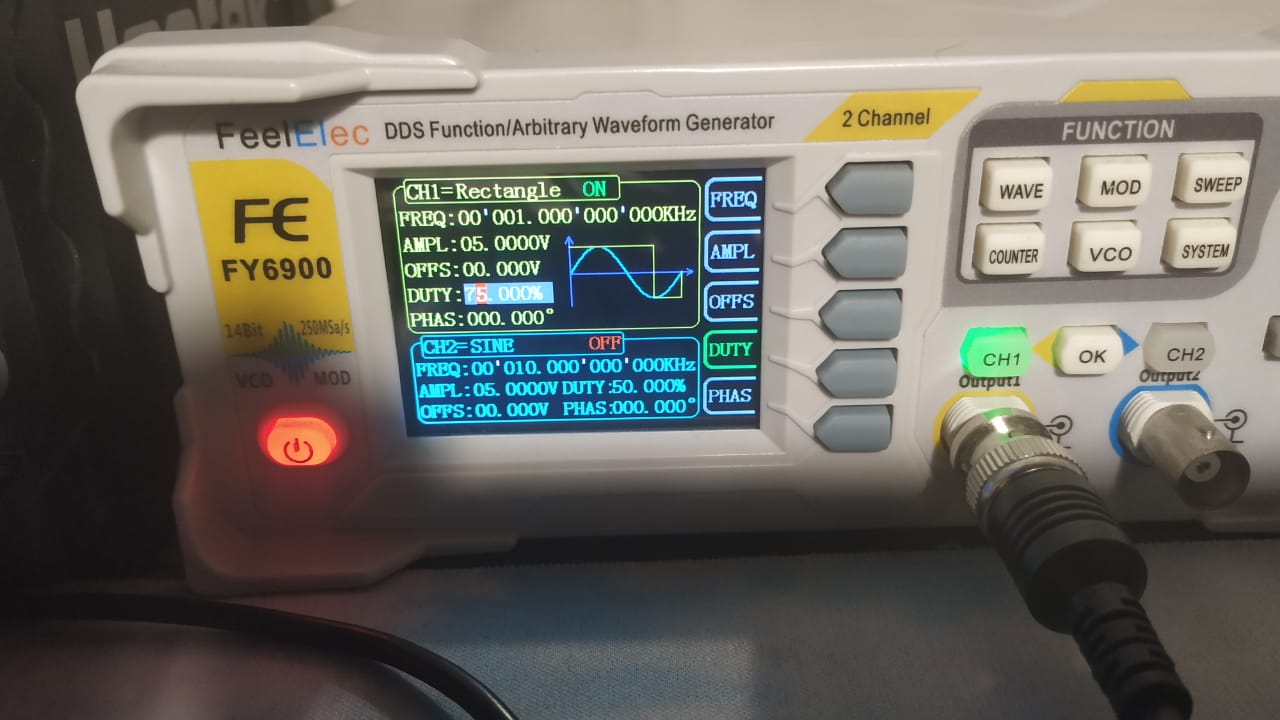 And as we can see, the signal obtained by the arduino is the same as the waveform generator created.

We hope to add some new features to our software. Feature like using Arduino's analog pin to obtain analog signals and real time graph drawing. We're also looking to port the software for MAC OS Users.