


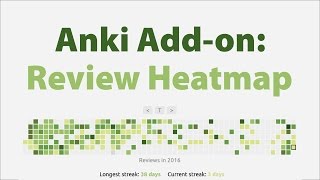
Your learning performance at a glance
Adds a heatmap graph to Anki's main window which visualizes past and future card review activity, similar to the contribution view on GitHub. Information on the current streak is displayed alongside the heatmap. Clicking on an item shows the cards reviewed on that day.
| General Overview | Customization |
|---|---|
 |
 |
(Make sure to enable closed-captions for comments on the demonstrated features)
The installation and use of the add-on is documented in the Wiki section and a series of video tutorials on YouTube. More information may also be found in the AnkiWeb description.
Review Heatmap is Copyright © 2016-2019 Aristotelis P.
Inspired by GitHub's contribution calendar and Forecast graph on Overview page by Steve AW.
Ships with the following javascript libraries:
- d3.js (v3.5.17), (c) Mike Bostock, BSD license
- cal-heatmap (v3.6.2), (c) Wan Qi Chen, MIT license
Review Heatmap is free and open-source software. The add-on code that runs within Anki is released under the GNU AGPLv3 license, extended by a number of additional terms. For more information please see the license file that accompanied this program.
This program is distributed in the hope that it will be useful, but WITHOUT ANY WARRANTY. Please see the license file for more details.