An easy-to-use python implementation of the mapper algorithm
- Runs in Python 3.7
- Input: text file with vectors on each line, coordinates separated by spaces
- Output: image of simplicial complex of data, or text file with simplicial complex structure
The packages numpy, pandas, networkx, matplotlib, and pyclustering are necessary. Default usage is:
python easy-mapper.py datafile
A .png file will be created in your current directory that visualizes the data.
Usage with more options is possible, with the following arguments:
--filter=projection: Type of filter function to use. Options areprojection,nearest,density,eccentricity.--intervals=10: Number of intervals to use.--overlap=0.1: Overlap percentage from one interval to the next.--out='mpl': Type of output. Default is an image made bymatplotlib, also'txt'can be used for a text file output.
--filter_projection: Dimension on which to project. Integer at least0, default is0.--filter_nearest: Number of nearest neghbors to take. Integer at least1, default is3.--filter_density: Epsilon parameter for smoothness. Assumes Gaussian distribution. Positive float, default is0.5.--filter_eccentricity: Exponent of terms in a sum and of the whole sum. Integer at least1, default is1.--ids: Only relevant for the--output='txt'option. If--ids=True, then the input file is assumed to have a first column that holds the name for the vector on that line. The ids are printed in the output text file, and can be useful for making finer graphs.--out_labels--out_legend--out_legend_n
A sample of 500 points from a circle, with noise, is included in examples/circle.txt. The points are sampled as below:

Calling easy-mapper is straightforward, and produces the following informational output:
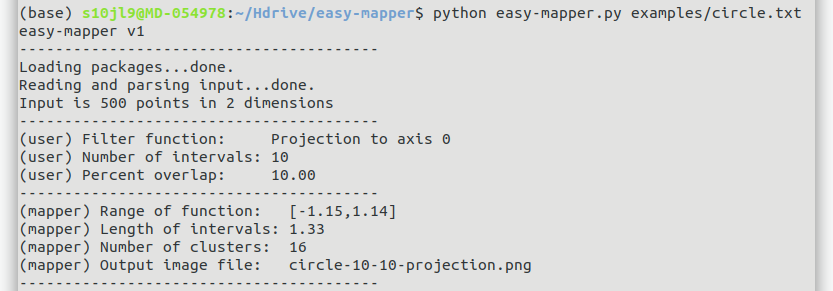
The output is a file called circle-10-10-projection.png, referenceing the default settings of 10 intervals, 10% overlap, and projection to the first axis as a filter.
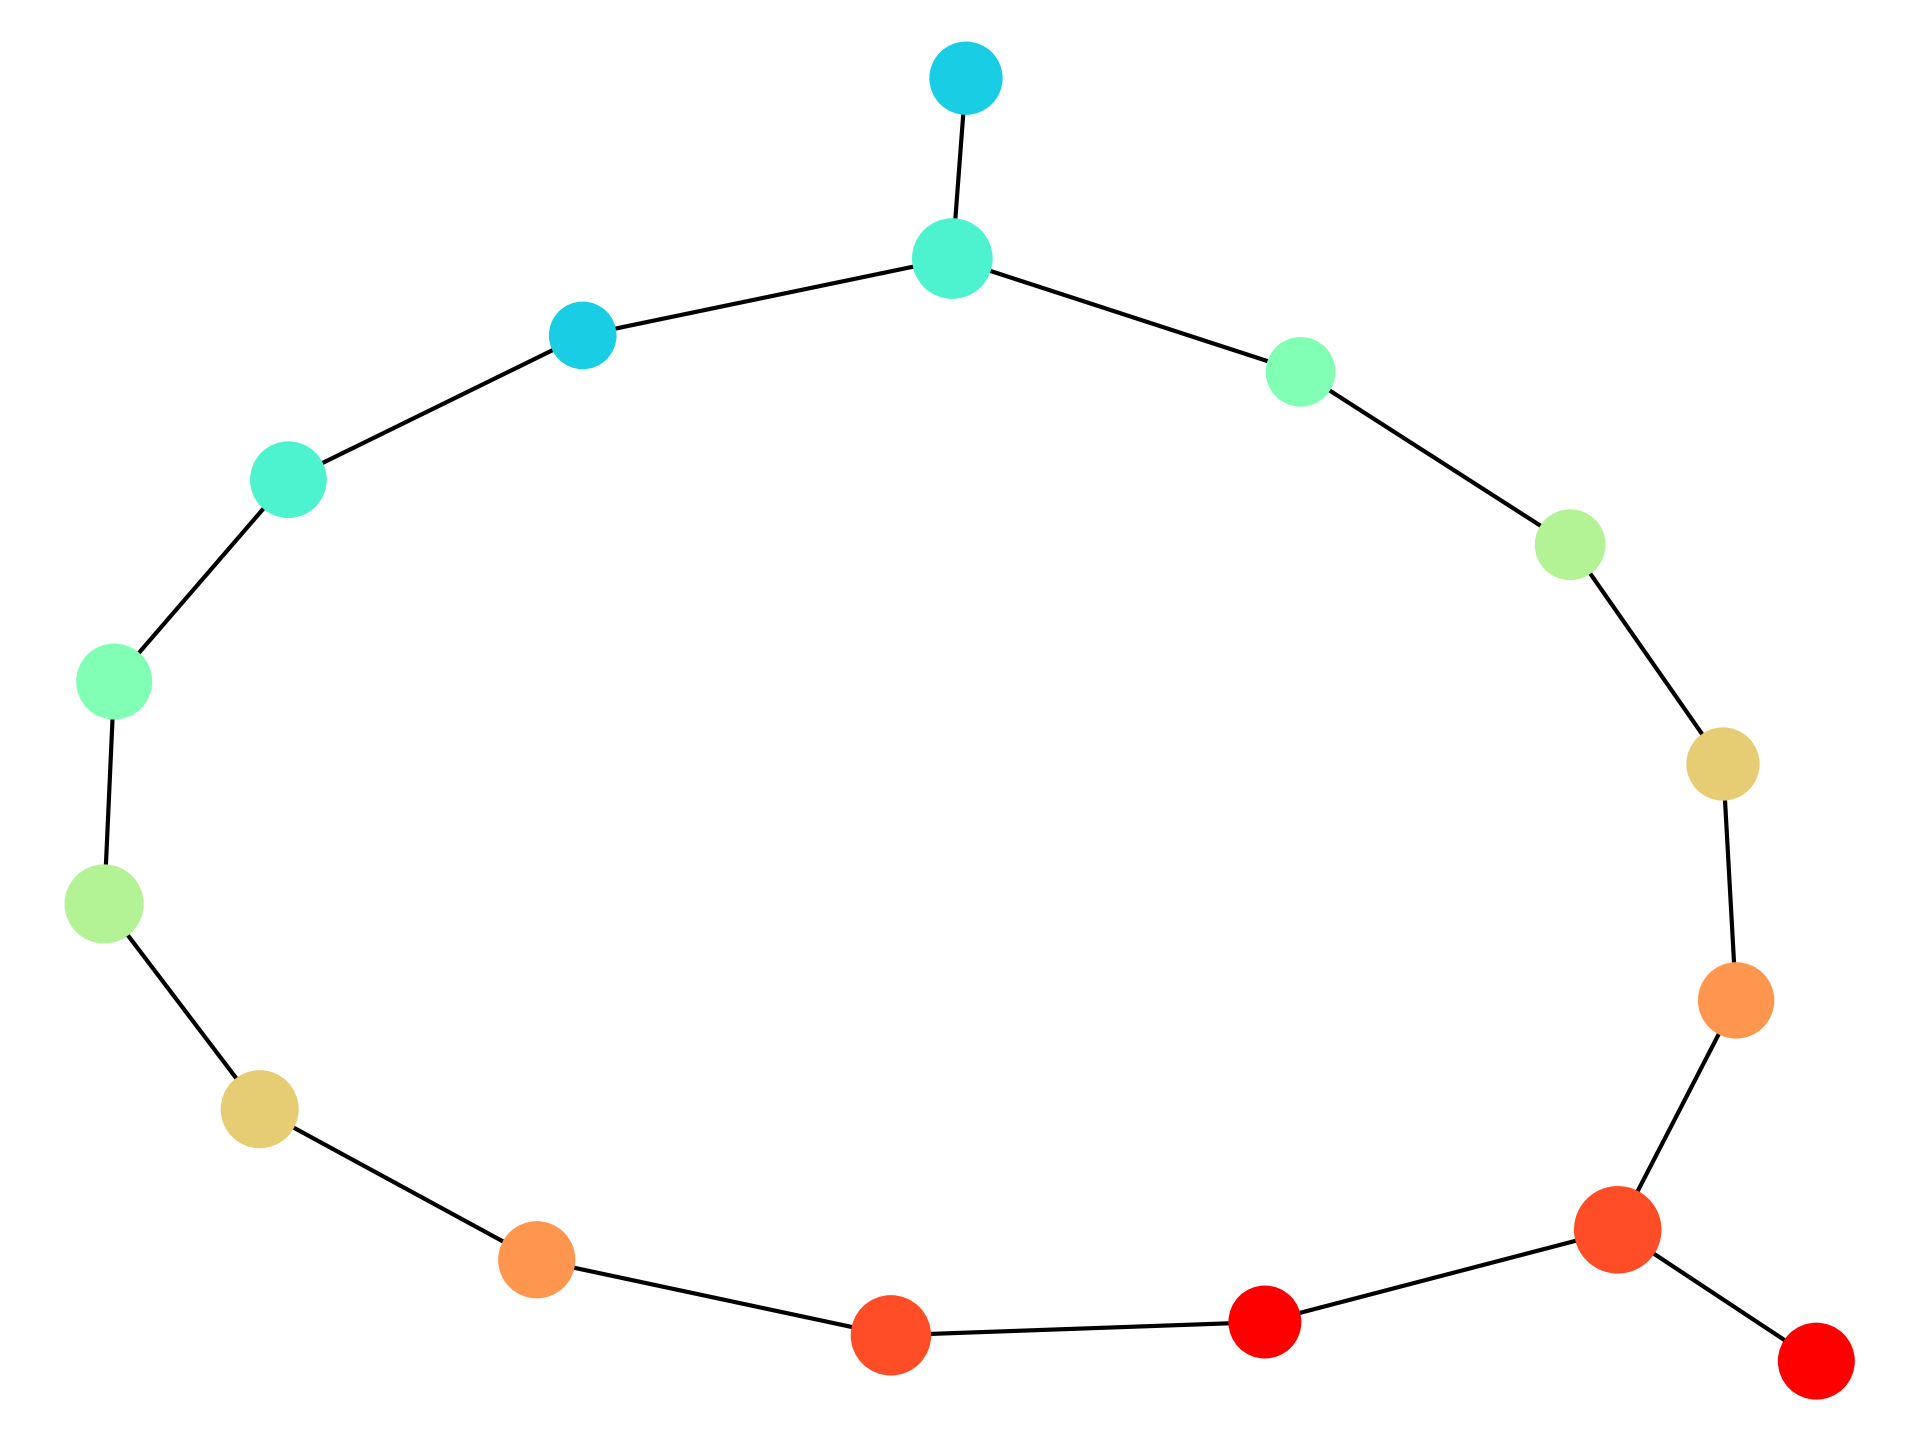
This reflects the circle's geometry. The two vertices of degree 3 are at the ends, where the clustering part wants to find at least two clusters. Running the same command with the flag --filter=density produces the following result:
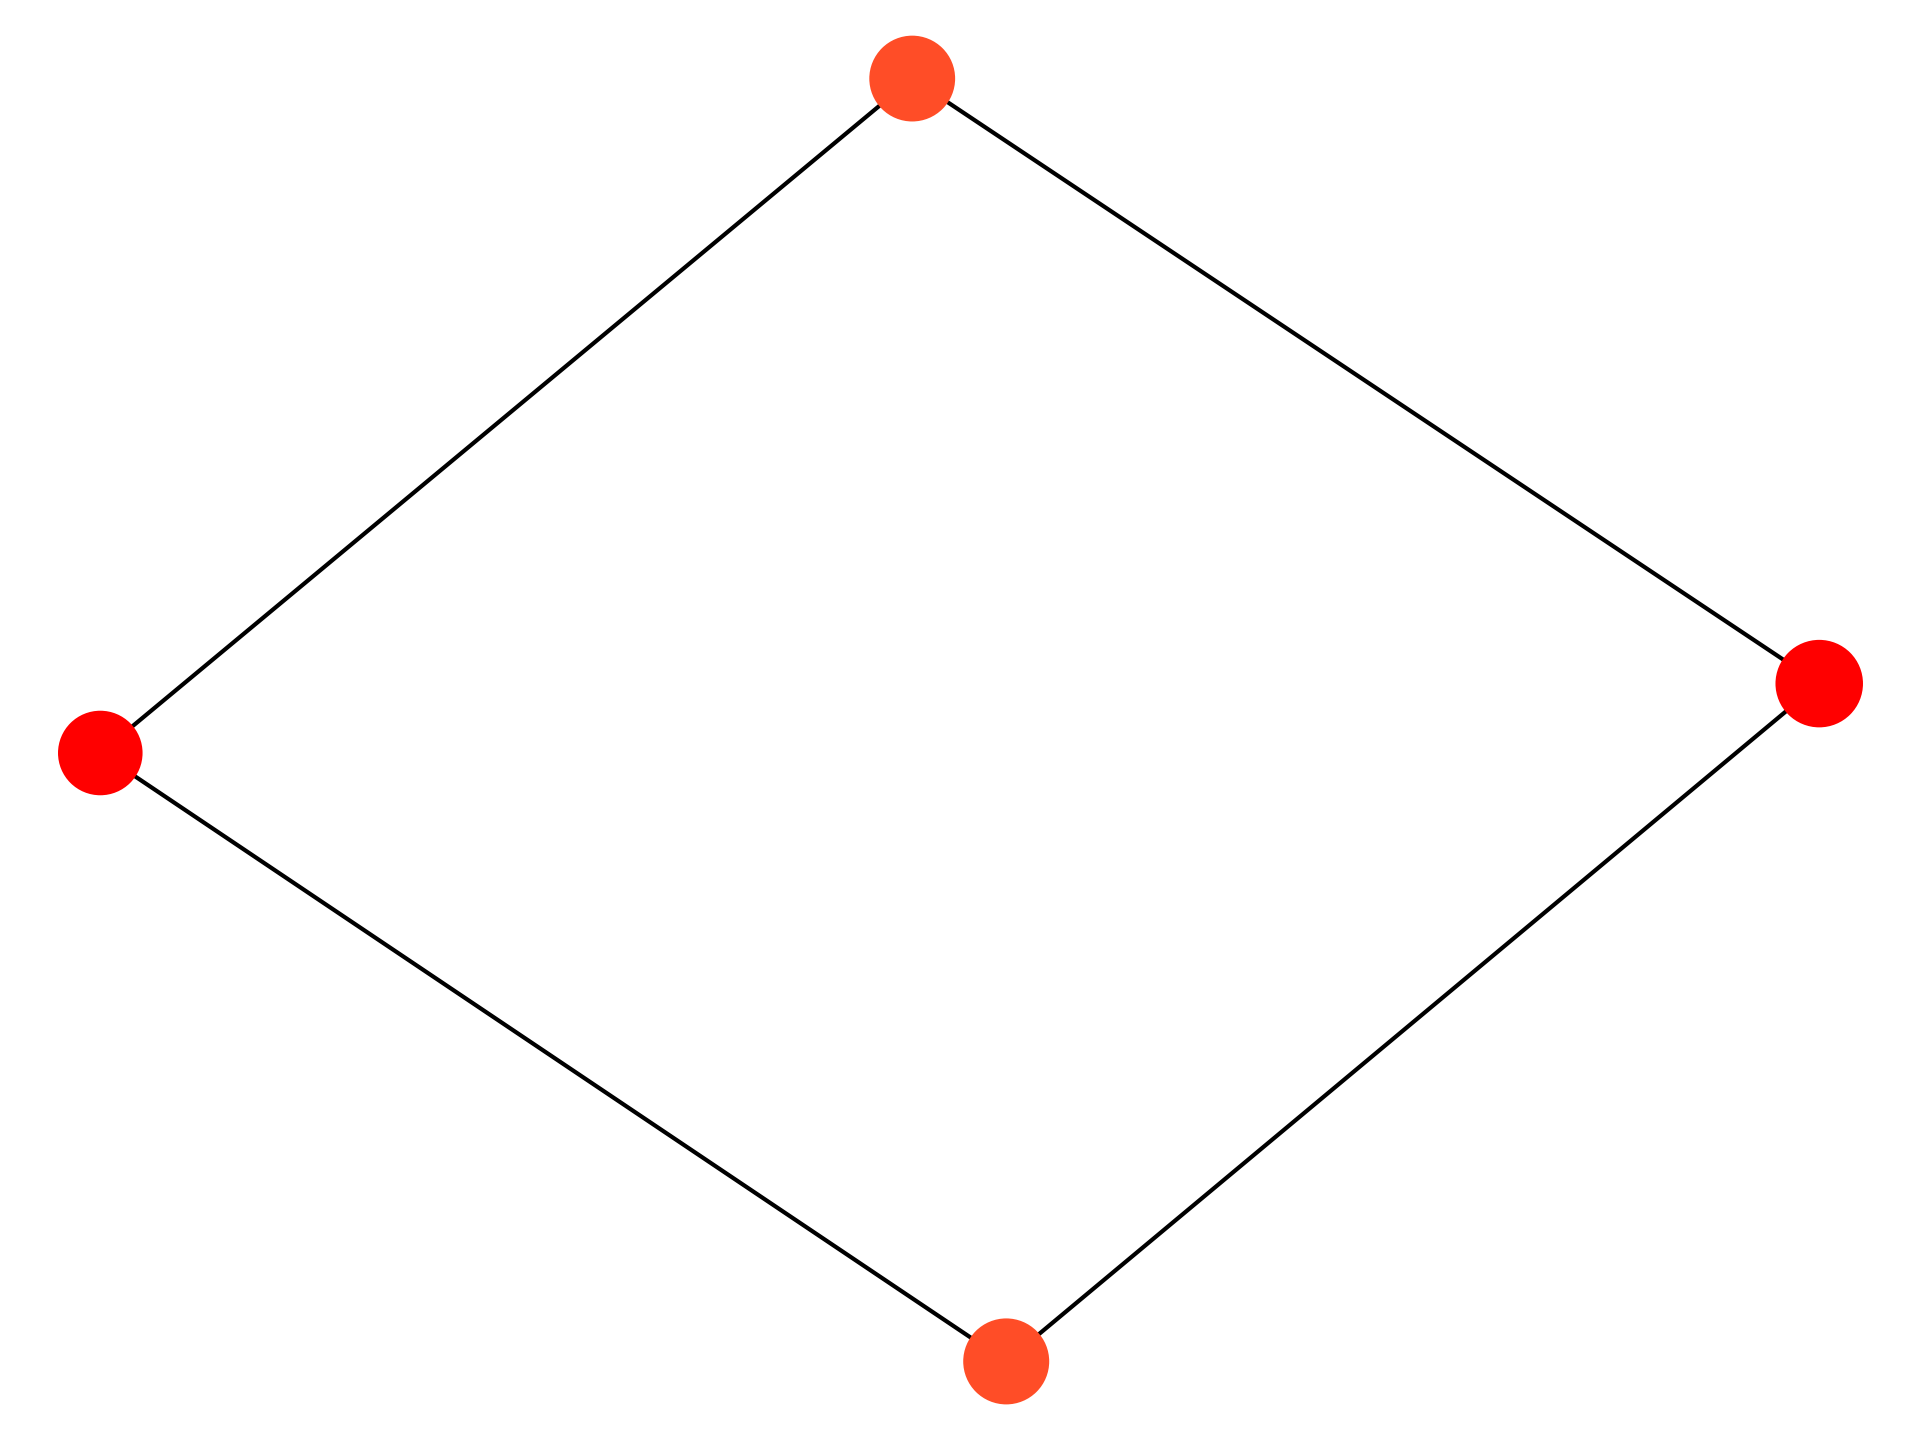
This also reflects the geometry of the input.
There are several shortcomings to the easy-mapper implementation:
- Only works with 1-dimensional filter functions
- Cluster function has to be changed manually by (un)commenting code. This will be updated in later versions.
- No way to use custom filter function except by changing the code. Goal is to use auxiliary file containing filter function as input.
2020-01-20 : Added eccentricity filter function.
2019-11-19 : Added example of circle. Renamed output file. User messaged if filter is unrecognized.
2019-11-17 : Filter option functional: projection, nearest neighbors, or density.
2019-11-06 : Split main file into subfiles. Added "both" option for output (matplotlib and write to text file).
2019-11-03 (v1) : Github repo initiated, first version with basic functionality and options
2019-10-31 : Work started on easy-mapper
2007: Carlsson--Singh--Memoli publish the mapper paper Topological Methods on which this is based
- Make a table of why this is useful, compare with other mapper versions
- Make more examples (swirl, 3D)
- Make cluster function optionable
- Add custom and 2-dimensional filter options