visualize Sar data
Copy env.example to .env. then replace # GRAFANA_HOST=<hostname/IP without http> by GRAFANA_HOST=<yourhost ip>
Run docker-compose up --build -d
Make sure all docker containers are Up with running docker-compose ps
input URL http://<your host ip>:8001/ in browser
user: admin password: admin
click choose file, upload sar data file(test/) then select graph type. then click upload. BTW: All types will be selected if Check All is set.
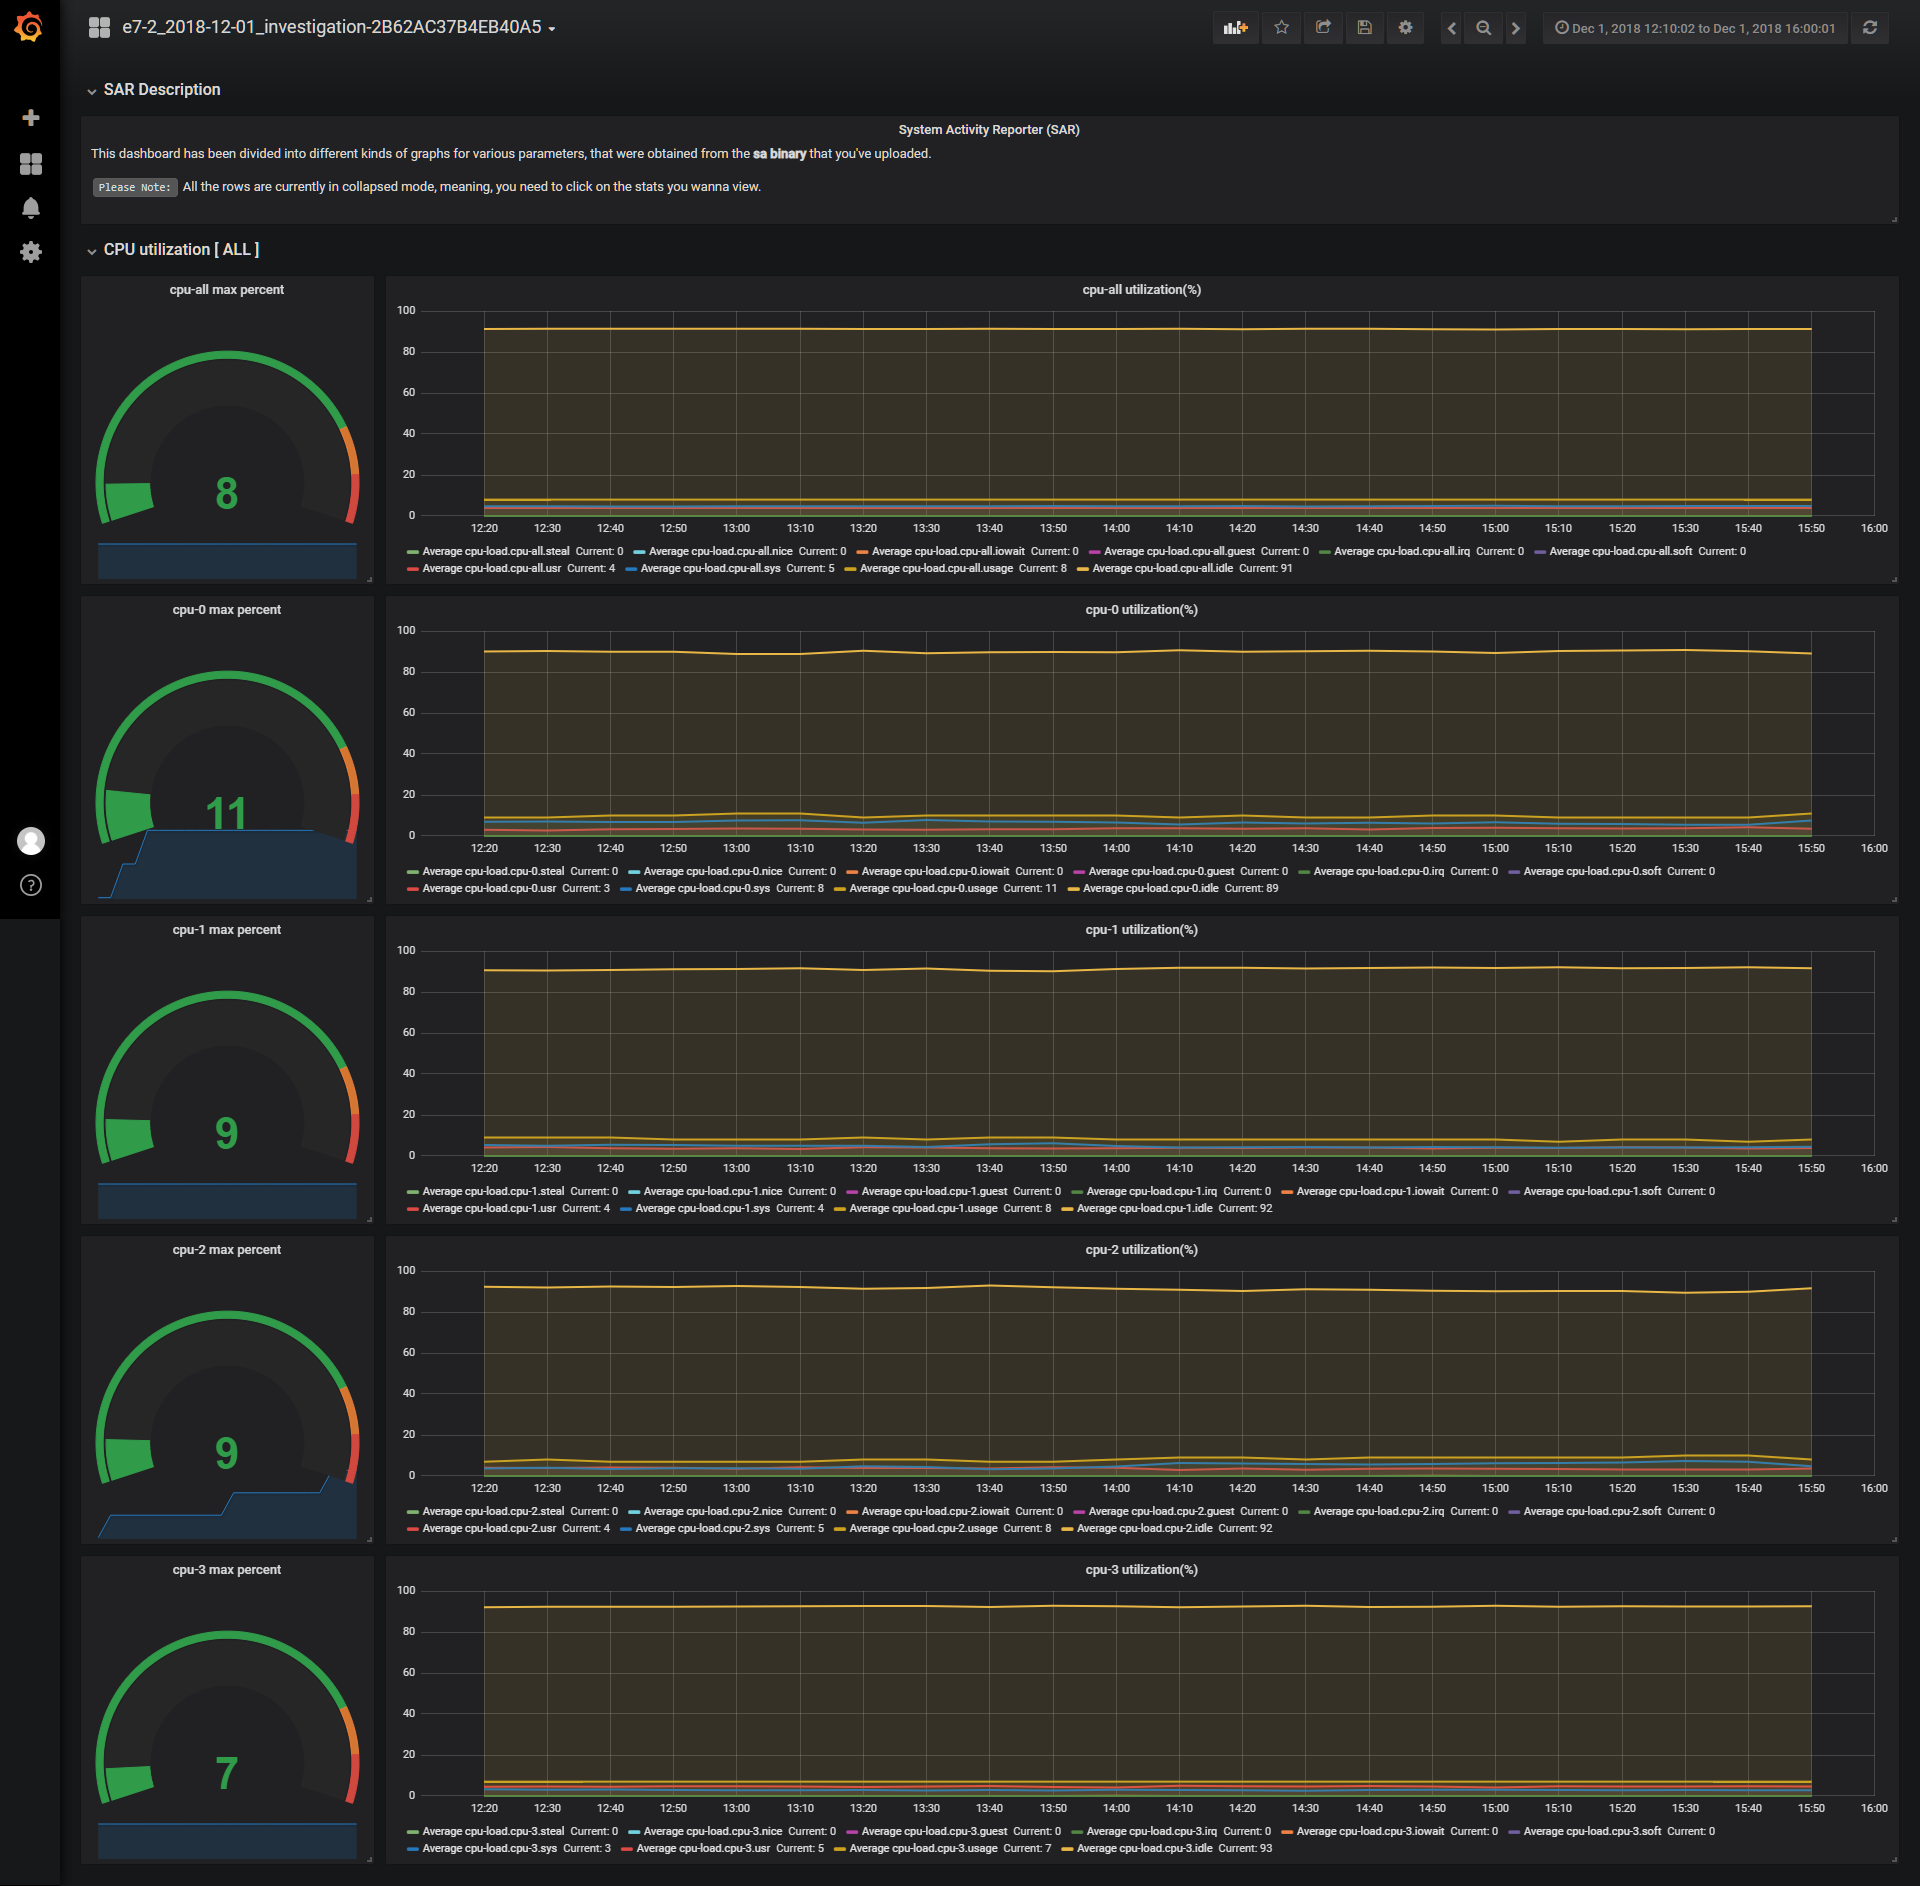
Click dashboard link URL to get your visualization dashboard (grafana user/passwd is admin/admin)