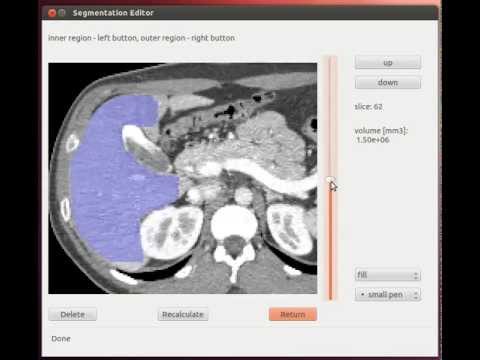
Segmentation tools based on the graph cut algorithm. You can see video to get an idea.
please cite:
@INPROCEEDINGS{jirik2013,
    author = {Jirik, M. and Lukes, V. and Svobodova, M. and Zelezny, M.},
    title = {Image Segmentation in Medical Imaging via Graph-Cuts.},
    year = {2013},
    journal = {11th International Conference on Pattern Recognition and Image Analysis: New Information Technologies (PRIA-11-2013). Samara, Conference Proceedings },
    url = {http://www.kky.zcu.cz/en/publications/JirikMmjirik_2013_ImageSegmentationin},
}
https://github.com/mjirik/pysegbase
- Miroslav Jirik
- Vladimir Lukes
New BSD License, see the LICENSE file.
pip install gcopython pysegbase
See INSTALL file for more information
Create output.mat file:
python pysegbase/dcmreaddata.py -i directoryWithDicomFiles --degrad 4
See data:
python pysegbase/seed_editor_qt.py -f output.mat
Make graph_cut:
python pysegbase/pycut.py -i output.mat
Use is as a library:
import numpy as np
import pysegbase.pycut as pspc

data = np.random.rand(30, 30, 30)
data[10:20, 5:15, 3:13] += 1
data = data * 30
data = data.astype(np.int16)
igc = pspc.ImageGraphCut(data, voxelsize=[1, 1, 1])
seeds = igc.interactivity()

import numpy as np
import pysegbase.pycut as pspc
import matplotlib.pyplot as plt
# create data
data = np.random.rand(30, 30, 30)
data[10:20, 5:15, 3:13] += 1
data = data * 30
data = data.astype(np.int16)
# Make seeds
seeds = np.zeros([30,30,30])
seeds[13:17, 7:10, 5:11] = 1
seeds[0:5:, 0:10, 0:11] = 2
# Run
igc = pspc.ImageGraphCut(data, voxelsize=[1, 1, 1])
igc.set_seeds(seeds)
igc.run()
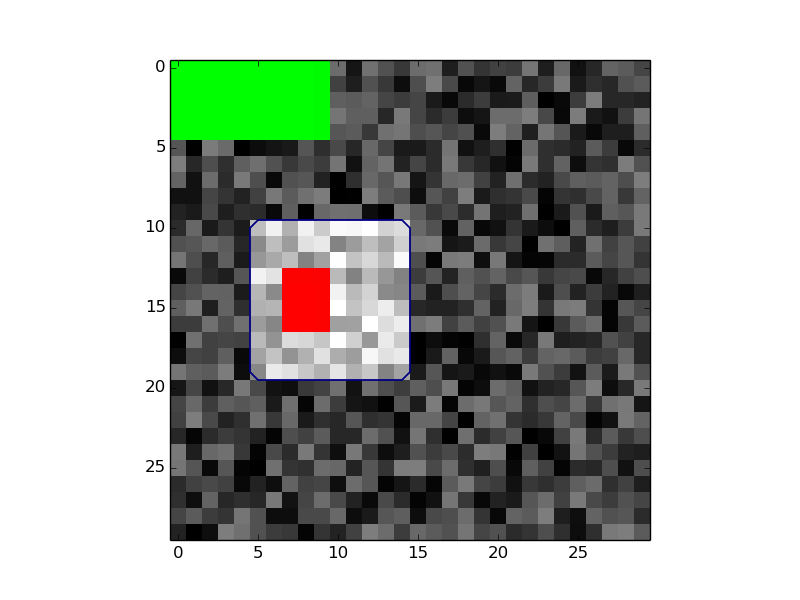
# Show results
colormap = plt.cm.get_cmap('brg')
colormap._init()
colormap._lut[:1:,3]=0
plt.imshow(data[:, :, 10], cmap='gray')
plt.contour(igc.segmentation[:, :,10], levels=[0.5])
plt.imshow(igc.seeds[:, :, 10], cmap=colormap, interpolation='none')
plt.show()
    segparams = {
        # 'method':'graphcut',
        'method': 'graphcut',
        'use_boundary_penalties': False,
        'boundary_dilatation_distance': 2,
        'boundary_penalties_weight': 1,
        'modelparams': {
            'type': 'gmmsame',
            'fv_type': "fv_extern",
            'fv_extern': fv_function,
            'adaptation': 'original_data',
        }
        'mdl_stored_file': False,
    }
mdl_stored_file: if this is set, load model from file