Mep Analysis and Visualization INstrument
A pyqtgraph application for viewing and interpreting EMG data
- A Terminal: you can use
cmd.exebut I recommend Git for Windows - Python 2.7.x
- Install python into the default option
C:\Python27if you can. Then, edit your PATH environment variable to includeC:\Python27(instructions here).
- Install python into the default option
- Pip for python package management
- Pip is included in the standard python installation on windows. Simply add the
C:\Python27\Scriptsdirectory to yourPATHvariable (separate directories using a semicolon), and pip should be accessible from the command line.
- Pip is included in the standard python installation on windows. Simply add the
- Python 2.7.x
- Pip for python package management
- First, try this: open a terminal and run the command
sudo easy_install pip. If this doesn't work, - Download get-pip.py and run the command
sudo python /path/to/get-pip.pyin your terminal.
- First, try this: open a terminal and run the command
=
=
Many of these packages have been archived by Christopher Gohlke in order to be easy to install. For several of these requirements, I'll link to his Unofficial Windows Binaries page. Simply find the package you want, select the correct version based on your architecture (32- or 64-bit) and python version (use "27" or "26" depending on the version of Python you downloaded). For example:
| Your Python Version | Your system architecture | You should download |
|---|---|---|
| 2.6.x | 32-bit | numpy‑1.9.2+mkl‑cp26‑none‑win32.whl |
| 64-bit | numpy‑1.9.2+mkl‑cp26‑none‑win_amd64.whl | |
| 2.7.x | 32-bit | numpy-1.9.2+mkl-cp27-none-win32.whl |
| 64-bit | numpy‑1.9.2+mkl‑cp27‑none‑win_amd64.whl |
A wheel is a ZIP-format archive with a specially formatted filename and the .whl extension. More info on python wheels here. Once you download the correct wheel file, use pip in the terminal to install it:
pip install C:\Users\chris\Downloads\numpy‑1.9.2+mkl‑cp27‑none‑win_amd64.whl- NumPy for numerical computing
- Gohlke's NumPy+MKL packages
- Alternatively, try the most recent supported version 1.9.2 available on the sourceforge page (not much advantage since Gohlke has archived 1.9.2).
- neo for reading electrophysiology data in Python
- Run the command
pip install neoin your terminal.
- Run the command
- PyQt4
- PyQtGraph
- On Gohlke's download page under "Misc". Search for the file
pyqtgraph‑0.9.10‑py2.py3‑none‑any.whl - Alternatively, the PyQtGraph homepage has windows installers.
- On Gohlke's download page under "Misc". Search for the file
=
- NumPy for numerical computing
- Run
sudo pip install numpyin your terminal.
- Run
- neo for reading electrophysiology data in Python
- Run
sudo pip install neoin your terminal.
- Run
- Qt 4.8.x Libraries
- Download the installer (
qt-opensource-mac-4.8.6-1.dmg) from the Qt 4.8.6 archive page
- Download the installer (
- PyQt4
- Download the source, compile and install it
- This is more complicated on Macs, I wrote some instructions here
- PyQtGraph
- Run
sudo pip install pyqtgraphin your terminal. - If this doesn't work, follow the instructions on the PyQtGraph homepage
- Run
If you have git available in your command line or terminal, execute:
git clone git://github.com/chrismullins/MEPViewer.gitor simply download and extract the tarball from this page.
Once you have downloaded the repository, run it in a terminal:
python bin/MEPViewerApp.pyThis should open up the main windows. From here you should be able to interact with the software through this window.
Ctrl+X: Exit the application
Ctrl+O: Open a data file
Ctrl+A: Annotate the signal
Ctrl+S: Save info to CSV
Ctrl+W: Clear the window to load another data file
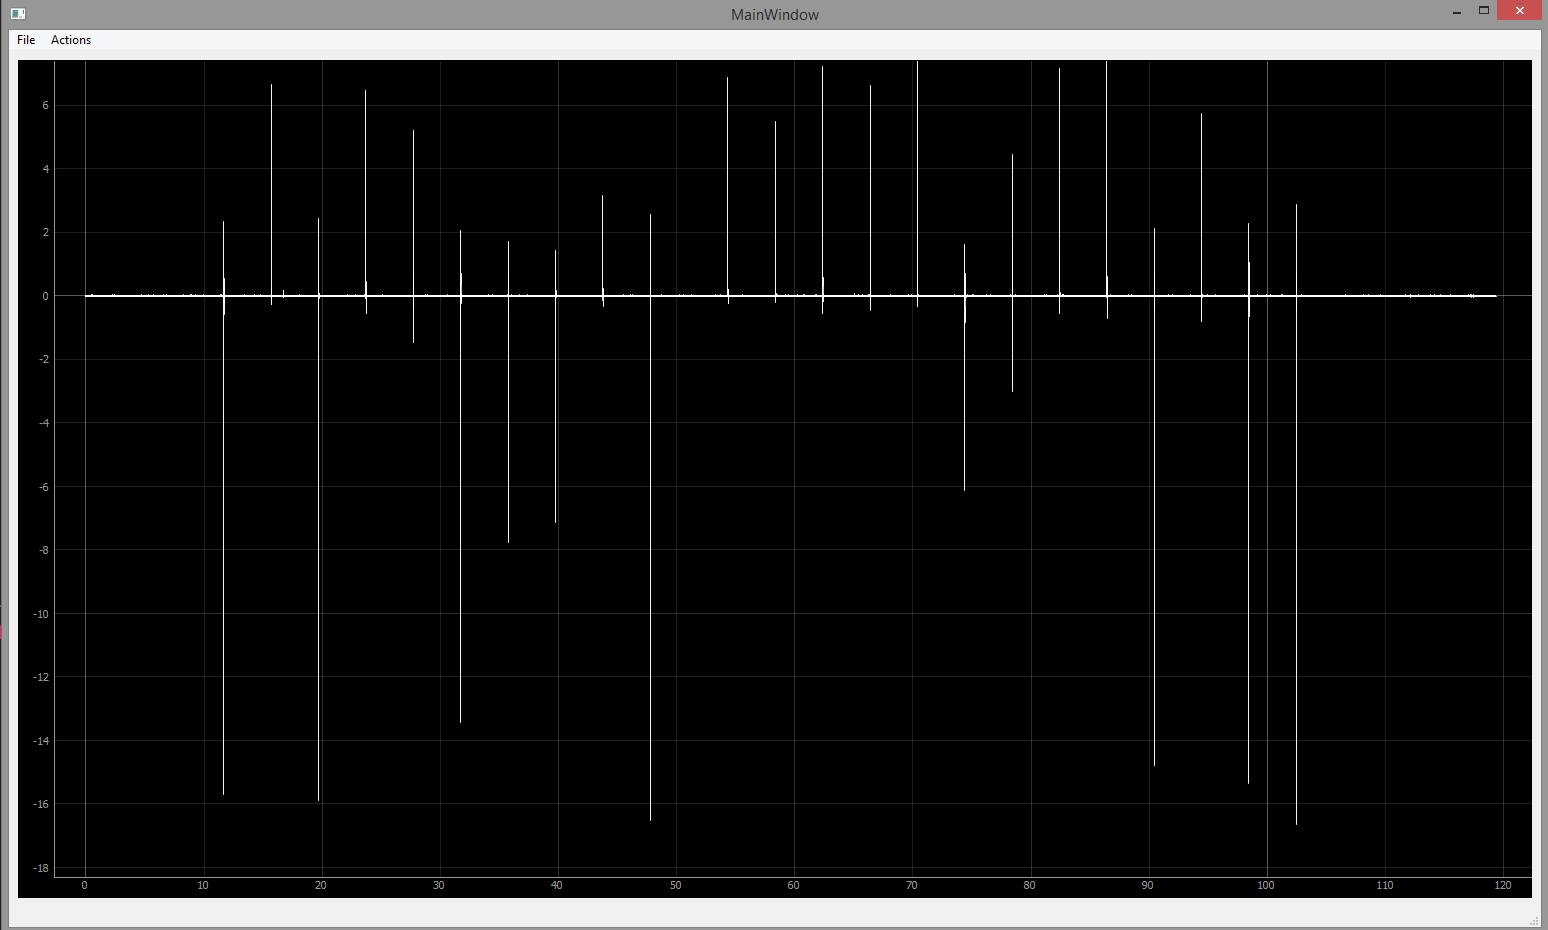
The main window, after loading a data file, should look something like this:
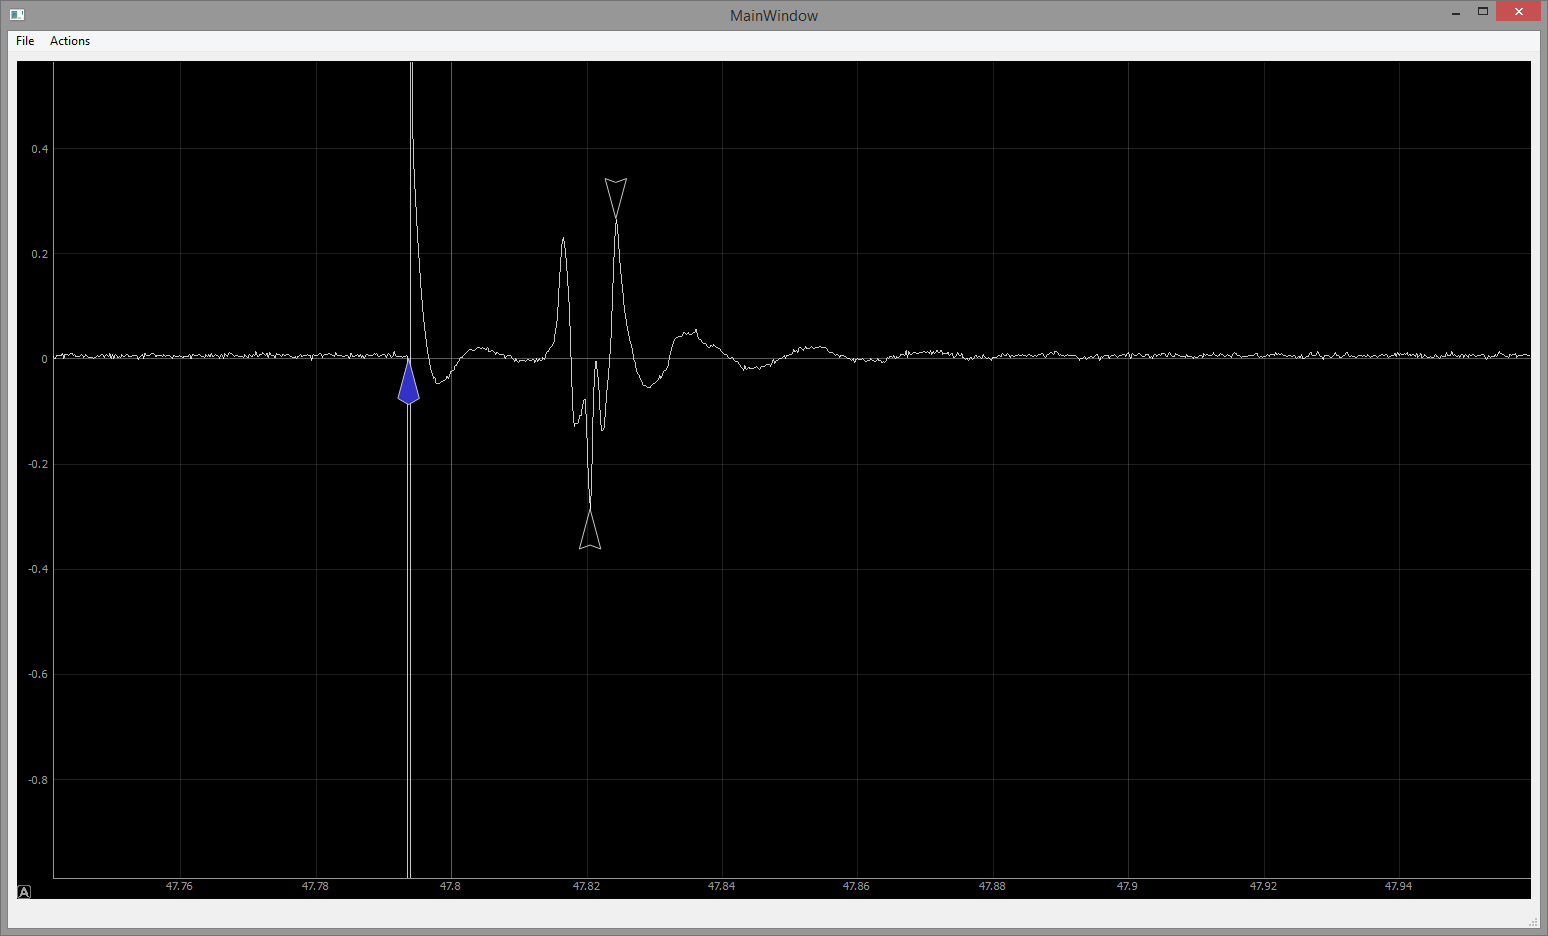
Use the scroll wheel inside the plot to zoom in or out, and on the axes to scale the axes. Clicking and dragging inside the plot allows you to zoom in on any part of the plot:
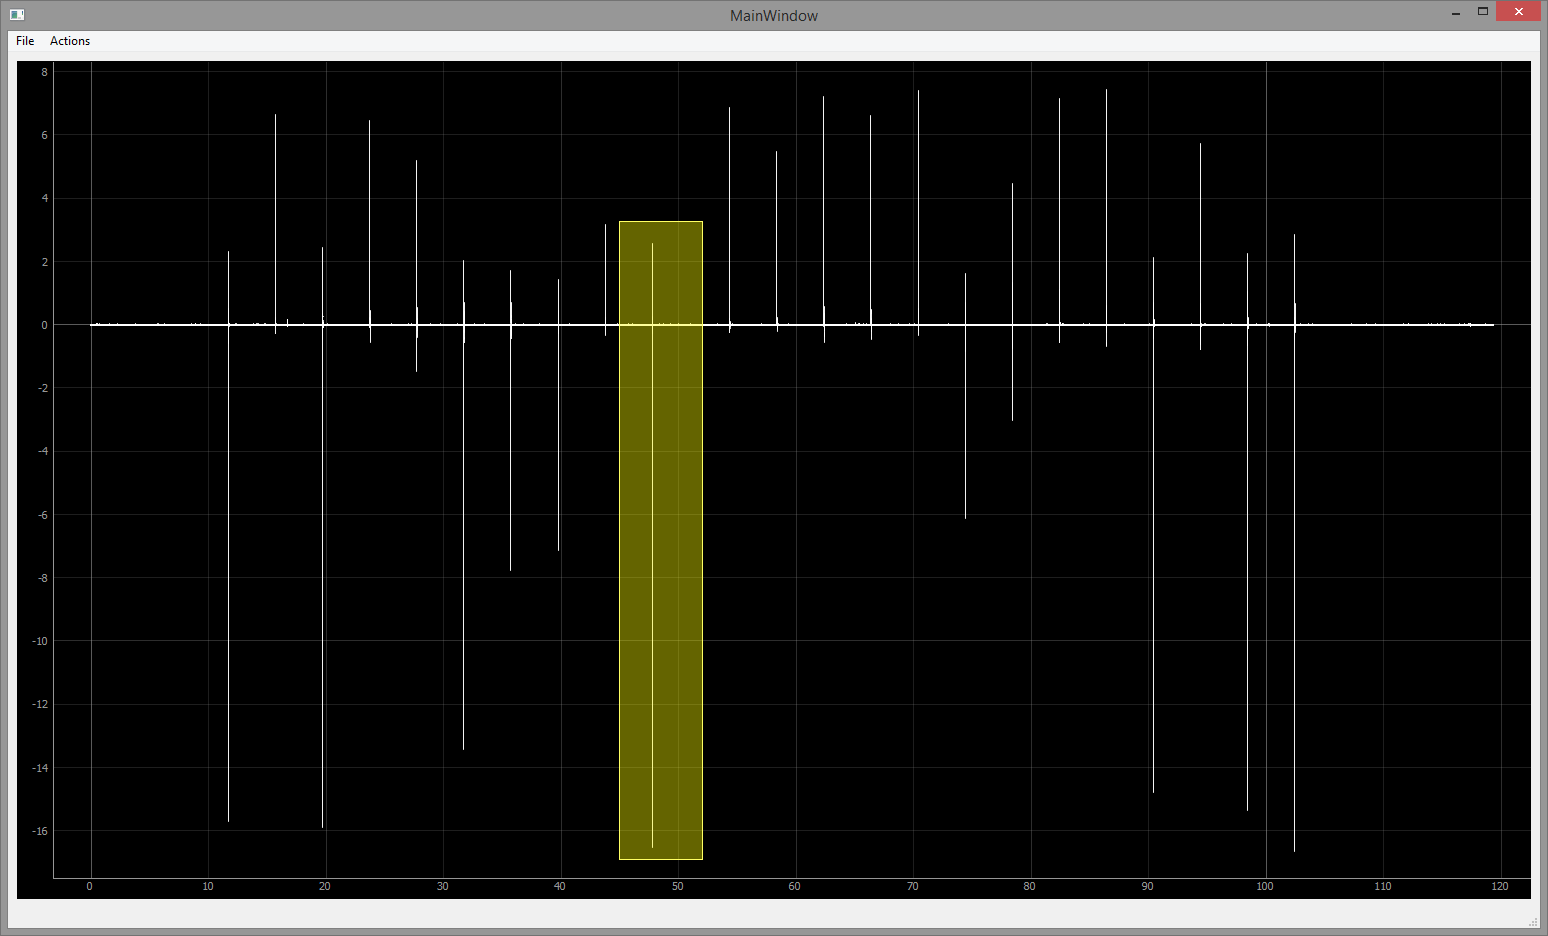 Use the
 Ctrl+A shortcut to annotate the triggers along with their max and min responses, or navigate through the top-level menu.