GiniClust is a clustering method implemented in Python and R for detecting rare cell-types from large-scale single-cell gene expression data.
GiniClust can be applied to datasets originating from different platforms, such as multiplex qPCR data, traditional single-cell RNAseq or newly emerging UMI-based single-cell RNAseq, e.g. inDrops and Drop-seq.
GiniClust is created and maintained by the GC Yuan Lab at Harvard University and the Dana-Farber Cancer Institute and comes with a graphical user interface for convenience:
Please ensure that you have Python 2.7 in your environment. The graphical user interface of GiniClust relies on wxPython, a Python wrapper for the cross-platform wxWidgets API. Instructions on how to install wxPython are available on the corresponding website. On Fedora Linux, the following at the command-line interface worked just fine:
$ sudo dnf install wxPython.
In addition, GiniClust relies on the following libraries:
Gooey(version 0.9.2.3 or ulterior);setuptools(version 24.0.2 or subsequent).
Those packages should be automatically installed or upgraded via a pip installation. For instance, to install Gooey, proceed as follows:
- start a terminal session;
- run
$ pip install Gooey --upgrade.
If in doubt, please check that those libraries got installed properly by trying to import them or some of their modules in your Python interpreter: >>> import gooey, pkg_resources.
As for the R code at the core of much of GiniClust`s computations, for MAC and WINDOWS only the official R installation file is supported and tested. Using other installation methods, such as brew, may lead to running error.
Besides, some users might experience issues installing another of GiniClust's dependencies: the MAST R package. If this happens, please visit the MAST website (https://github.com/RGLab/MAST) for detailed instructions. We recommend that users upgrade MAST package to the newest version. If you are using an old version, you may need to replace the file DE_MAST.R in 'Rfunction' by DE_MAST.R in 'Archive'.
The input file is a gene expression matrix in comma-separated value (csv) format.
Specifically, for qPCR data, each row is log2 gene expression level; for RNAseq data, each row is UMI-Count/Cell or Raw-Read-Count/Cell (Note: log2 transformed RNA-seq data for Giniclust may not work! We suggest that user use featureCounts from http://subread.sourceforge.net/ or htseq-count from http://www-huber.embl.de/users/anders/HTSeq/doc/counting.html to get raw reads counts ). The first row contains cell IDs. The first column contains unique gene names.
For example, in R
>ExprM.RawCounts  <- read.csv("Data_GBM.csv", sep=",", head=T)
>ExprM.RawCounts[1:4,1:4]
you can take a look at one of our test datasets (stored in the sample_data folder within GiniClust's repository):
| Table | MGH26 | MGH26.1 | MGH26.2 | MGH26.3 |
|---|---|---|---|---|
| 1/2-SBSRNA4 | 0 | 47 | 0 | 0 |
| A1BG | 41 | 80 | 3 | 0 |
| A1BG-AS1 | 0 | 0 | 0 | 0 |
| A1CF | 0 | 0 | 0 | 0 |
To run GiniClust, please download the GiniClust GitHub repository, unzip it and move to the extracted directory so that it becomes your current working directory.
Then, in a Linux environment, proceed as follows:
- start a terminal session;
- enter
$ python GiniClust.py.
From an OS X or Windows environment, proceed as follows:
- launch a terminal session;
- enter
$ pythonw GiniClust.py.
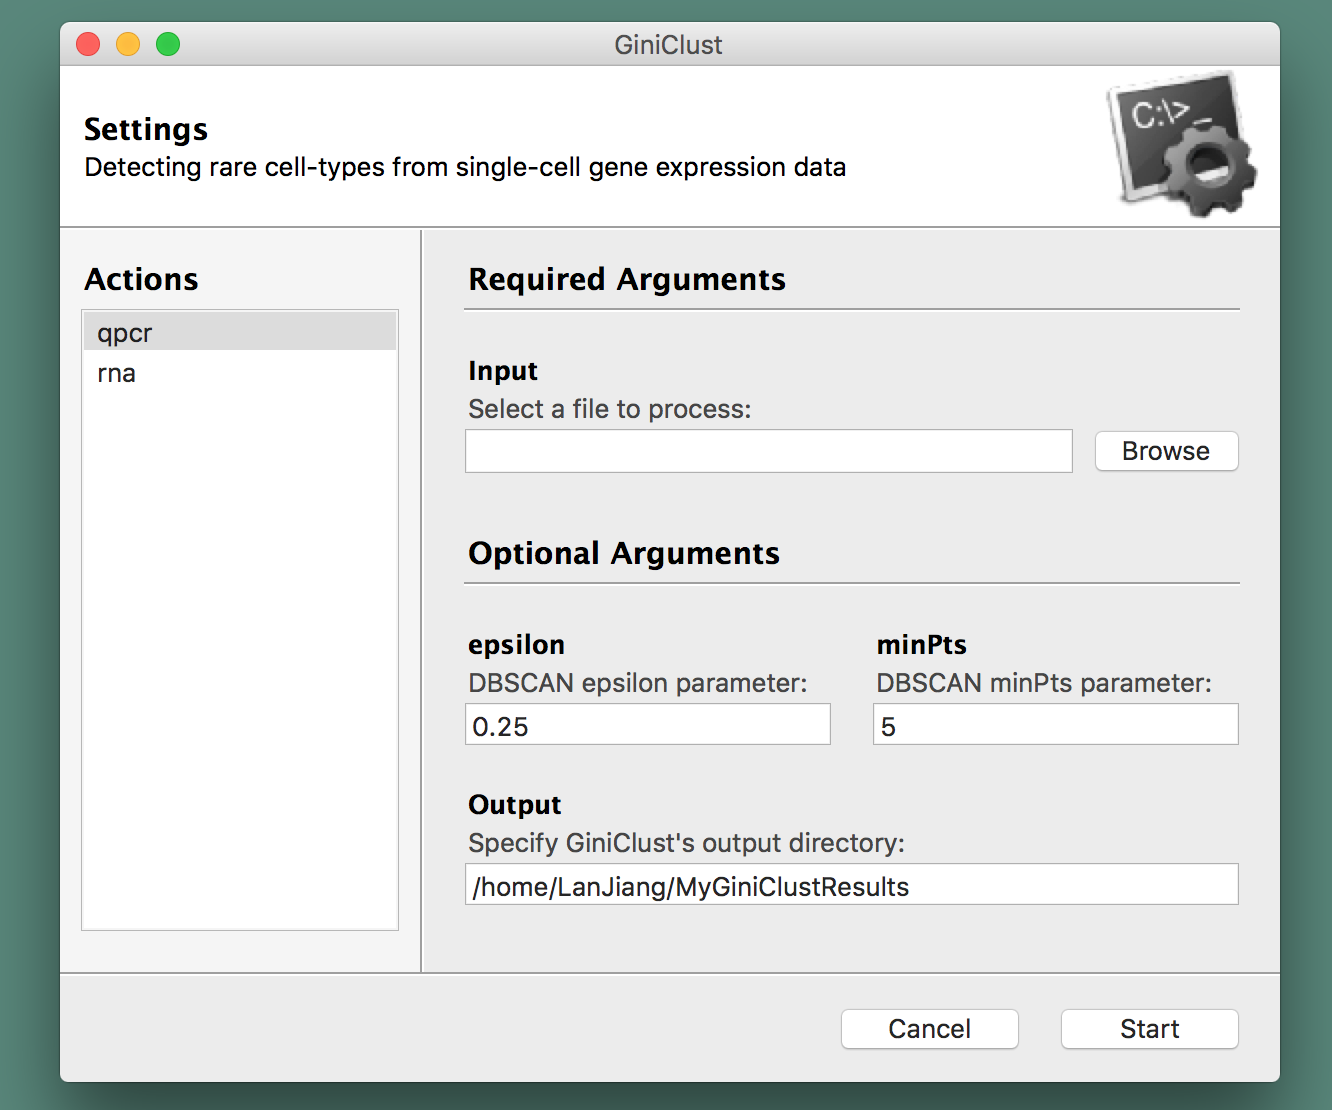
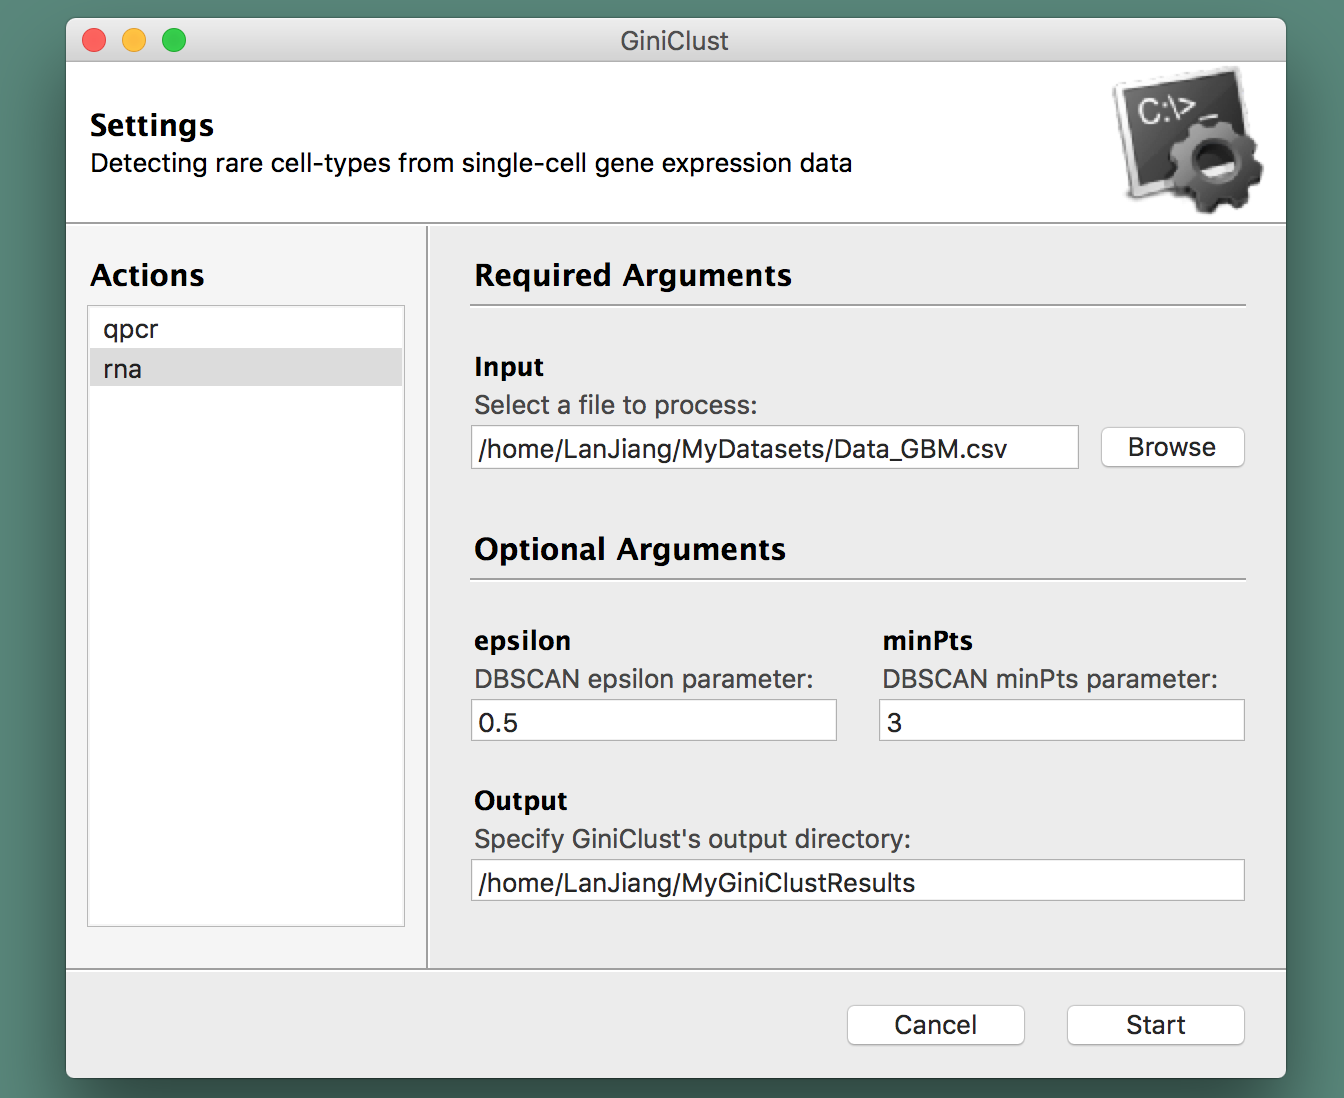
A graphical user interface will spring up and direct you into choosing a file to process from your arborescence of directories, specify the type of data at hand (qPCR or RNA-seq), along with the name of the folder where you would like to store GiniClust's output (see the section below for more information about those files). A screenshot is provided herewith:
Alternatively, GiniClust can be run directly as an R script at the command-line interface:
$ Rscript Giniclust_Main.R [options]
You can specify the following options:
- -f CHARACTER or --file=CHARACTER, input dataset file name
- -t CHARACTER or --type=CHARACTER, input dataset type: choose from 'qPCR' or 'RNA-seq'
- -o CHARACTER or --out=CHARACTER, output folder name [default=results]
- -e DOUBLE or --epsilon=DOUBLE, DBSCAN epsilon parameter qPCR:[default=0.25],RNA-seq:[default=0.5]
- -m INTEGER or --minPts=INTEGER, DBSCAN minPts parameter qPCR:[default=5],RNA-seq:[default=3]
- -h or --help, Show help message and exit
For example, the following command is used to analyze the 'Data_GBM.csv' dataset
$ Rscript GiniClust_Main.R -f Data_GBM.csv -t RNA-seq -o GBM_resultsThe following command is used to analyze the 'Data_qPCR.csv' dataset.
$ Rscript GiniClust_Main.R -f Data_qPCR.csv -t qPCR -o qPCR_resultsThe output directory specified by the user at the graphical user interface will contain the following files and directories:
- Dataname_rawCounts.csv: the raw counts
- Dataname_normCounts.csv: the normalized counts
- Dataname_gene.expression.matrix.RawCounts.filtered.csv: the raw counts after filtering
- Dataname_gene.expression.matrix.normCounts.filtered.csv: the normalized counts after filtering
- Gini_related_table_RNA-seq.csv: the table related with Gini index for RNA-seq data
- Gini_related_table_qPCR.csv: the table related with Gini index for qPCR data
- Dataname_clusterID.csv: clustering result, the first column represents cell IDs and the second column is the corresponding cluster result for each cell.
- Dataname_Rtnse_coord2.csv: coordinates of cells in tSNE plot
- Dataname_rare_cells_list.txt: the clusters of rare cells detected by Giniclust
- Dataname_bi-directional.GiniIndexTable.csv: For qPCR data the table of bidirectional Gini index
- RareCluster_lrTest.csv: lrTest results by MAST analysis for RNA-seq data
- RareCluster.diff.gene.t-test.results.csv: t-test results for qPCR data
- RareCluster.overlap_genes.txt: overlap genes between the selected high Gini genes and DE genes in rare cluster
- sub-folder 'figures':
- Dataname_histogram of Normalized.Gini.Socre.pdf: histogram of estimated p-values based on a normal distribution approximation for genes
- Dataname_smoothScatter_pvalue_gene.pdf: the smoothScatter plot in which the red points are the selected high Gini genes according to specified cutoff
- Dataname_tsne_plot.pdf: tSNE plot for cells
- Dataname_RareCluster_diff_gene_overlap.pdf: Venn diagram for differentially expressed genes and high gini genes
- Dataname_RareCluster_overlapgene_rawCounts_bar_plot.genename.pdf: barplot of rare cluster and major cluster for the overlap genes
Furthermore, a folder named 'Library' will be created, which includes a wealth of newly installed packages.
The GiniClust software was developped in support of a research project conducted at the GC Yuan Lab (Harvard University & DFCI). If you find it useful to your own investigations, please cite the following publication:
Jiang L, Chen H, Pinello L, Yuan GC. GiniClust: Detecting rare cell types from single-cell gene expression data with Gini Index. Genome Biology (2016) 17:144 DOI: 10.1186/s13059-016-1010-4
Lan Jiang (lan_jiang at hms dot harvard dot edu), the main developer of GiniClust, wrote the R scripts and started the README file. Gregory Giecold (ggiecold at jimmy dot harvard dot edu) developed the graphical user interface, reorganized the R packaging and edited the README file. Huidong Chen (hdchen at jimmy dot harvard dot edu) wrote the R command-line interface and contributed to the graphical user interface. Qian Zhu (qzhu at princeton dot edu) contributed to the graphical user interface. We would like to give special thanks to Luca Pinello who introduced the Gini-index and advised on the development and implementation of the GiniClust software.
Maintainers: Lan Jiang (lan_jiang at hms dot harvard dot edu), Huidong Chen (hdchen at jimmy do harvard dot edu) and Qian Zhu (qzhu at princeton dot edu).
For more information on the biological motivations underlying this project, please contact Lan Jiang (lan_jiang at hms dot harvard dot edu) or Guo-Cheng Yuan (gcyan at jimmy dot harvard dot edu).
Copyright 2016-2021 Lan Jiang and contributors.
GiniClust is free software made available under the MIT License. For details see the LICENSE file.