def showBandedContours(poly,values,num):
   """ Generate banded contours """
   high=max(values)
   low=min(values)

   bpdcf = vtk.vtkBandedPolyDataContourFilter()
   bpdcf.GenerateContourEdgesOn()
   bpdcf.SetScalarModeToValue()
   bpdcf.SetInputData(poly)
   bpdcf.GenerateValues(num,low,high)

   # The clip tolerance specifies a fraction of the scalar range
   # It is adjusted to reproduce the issue described
   bpdcf.SetClipTolerance(1e-6)
   bpdcf.SetScalarModeToIndex()
   #internalTol=bpdcf.GetClipTolerance()*(high-low)
   #print("internal clip tolerance={}".format(internalTol))

   m = vtk.vtkPolyDataMapper()
   m.SetInputConnection(bpdcf.GetOutputPort())
   m.SetScalarModeToUseCellData()
   m.SetScalarRange(0,num-1)

   bands = vtk.vtkActor()
   bands.SetMapper(m)

   m = vtk.vtkPolyDataMapper()
   m.SetInputConnection(bpdcf.GetOutputPort(1))
   m.ScalarVisibilityOff()

   edges = vtk.vtkActor()
   edges.GetProperty().SetColor(.4,.4,.4)
   edges.SetMapper(m)

   return bands,edges
 def __init__(self, module_manager):
     SimpleVTKClassModuleBase.__init__(self,
                                       module_manager,
                                       vtk.vtkBandedPolyDataContourFilter(),
                                       'Processing.', ('vtkPolyData', ),
                                       ('vtkPolyData', 'vtkPolyData'),
                                       replaceDoc=True,
                                       inputFunctions=None,
                                       outputFunctions=None)
    def band_contour_filter(self):
        band_contour_filter = vtk.vtkBandedPolyDataContourFilter()
        band_contour_filter.SetInputDataObject(self.statistic_mesh)
        band_contour_filter.SetNumberOfContours(self.n_contours)
        for idx, value in enumerate(self.statistic_thresholds):
            band_contour_filter.SetValue(idx, value)
        band_contour_filter.Update()
        self.band_contour_mesh = vtk.vtkPolyData()

        self.band_contour_mesh.DeepCopy(band_contour_filter.GetOutput())
        self.band_contour_mesh.BuildLinks()
def contourCase(poly, mode):
    """
   Create a renderer, actor, mapper to contour the polydata
   poly : polydata to contour
   mode : scalar-mode for BPDCF
   """
    # Prepare an array of point-data scalars

    # Perform the contouring. Note that we need to set scalar
    # mode to index because line cells do not get contour values
    # even if scalar mode is set to value.
    valueRange = poly.GetPointData().GetScalars().GetRange()
    num = 5
    bpdcf = vtk.vtkBandedPolyDataContourFilter()
    bpdcf.SetInputData(poly)
    bpdcf.GenerateValues(num, valueRange[0], valueRange[1])
    bpdcf.GenerateContourEdgesOff()
    if mode == 'index':
        bpdcf.SetScalarModeToIndex()
    elif mode == 'value':
        bpdcf.SetScalarModeToValue()
    bpdcf.Update()

    # Shrink all cells somewhat so the contouring of edges can
    # be seen better
    sf = vtk.vtkShrinkFilter()
    sf.SetShrinkFactor(0.90)
    sf.SetInputConnection(bpdcf.GetOutputPort())

    # Mapper shows contour index values
    m = vtk.vtkDataSetMapper()
    m.SetInputConnection(sf.GetOutputPort())
    m.SetScalarModeToUseCellData()
    m.SetScalarRange(
        bpdcf.GetOutput().GetCellData().GetArray('Scalars').GetRange())

    a = vtk.vtkActor()
    a.SetMapper(m)

    return a
    def _plotInternal(self):
        """Overrides baseclass implementation."""
        tmpLevels = []
        tmpColors = []
        indices = self._gm.fillareaindices
        if indices is None:
            indices = [1]
        while len(indices) < len(self._contourColors):
            indices.append(indices[-1])
        if len(self._contourLevels) > len(self._contourColors):
            raise RuntimeError(
                "You asked for %i levels but provided only %i colors\n"
                "Graphic Method: %s of type %s\nLevels: %s"
                % (len(self._contourLevels), len(self._contourColors),
                   self._gm.name, self._gm.g_name,
                   repr(self._contourLevels)))
        elif len(self._contourLevels) < len(self._contourColors) - 1:
            warnings.warn(
                "You asked for %i lgridevels but provided %i colors, extra "
                "ones will be ignored\nGraphic Method: %s of type %s"
                % (len(self._contourLevels), len(self._contourColors),
                   self._gm.name, self._gm.g_name))

        for i, l in enumerate(self._contourLevels):
            if i == 0:
                C = [self._contourColors[i]]
                if numpy.allclose(self._contourLevels[0][0], -1.e20):
                    # ok it's an extension arrow
                    L = [self._scalarRange[0] - 1., self._contourLevels[0][1]]
                else:
                    L = list(self._contourLevels[i])
                I = [indices[i]]
            else:
                if l[0] == L[-1] and I[-1] == indices[i]:
                    # Ok same type lets keep going
                    if numpy.allclose(l[1], 1.e20):
                        L.append(self._scalarRange[1] + 1.)
                    else:
                        L.append(l[1])
                    C.append(self._contourColors[i])
                else:  # ok we need new contouring
                    tmpLevels.append(L)
                    tmpColors.append(C)
                    C = [self._contourColors[i]]
                    L = tmpLevels[i]
                    I = [indices[i]]
        tmpLevels.append(L)
        tmpColors.append(C)

        luts = []
        cots = []
        mappers = []
        for i, l in enumerate(tmpLevels):
            # Ok here we are trying to group together levels can be, a join
            # will happen if: next set of levels contnues where one left off
            # AND pattern is identical
            mapper = vtk.vtkPolyDataMapper()
            lut = vtk.vtkLookupTable()
            cot = vtk.vtkBandedPolyDataContourFilter()
            cot.ClippingOn()
            cot.SetInputData(self._vtkPolyDataFilter.GetOutput())
            cot.SetNumberOfContours(len(l))
            cot.SetClipTolerance(0.)
            for j, v in enumerate(l):
                cot.SetValue(j, v)
            cot.Update()
            cots.append(cot)
            mapper.SetInputConnection(cot.GetOutputPort())
            lut.SetNumberOfTableValues(len(tmpColors[i]))
            for j, color in enumerate(tmpColors[i]):
                r, g, b = self._colorMap.index[color]
                lut.SetTableValue(j, r / 100., g / 100., b / 100.)
            luts.append([lut, [0, len(l) - 1, True]])
            mapper.SetLookupTable(lut)
            mapper.SetScalarRange(0, len(l) - 1)
            mapper.SetScalarModeToUseCellData()
            mappers.append(mapper)

        self._resultDict["vtk_backend_luts"] = luts
        if len(cots) > 0:
            self._resultDict["vtk_backend_contours"] = cots

        numLevels = len(self._contourLevels)
        if mappers == []:  # ok didn't need to have special banded contours
            mapper = vtk.vtkPolyDataMapper()
            mappers = [mapper]
            # Colortable bit
            # make sure length match
            while len(self._contourColors) < len(self._contourLevels):
                self._contourColors.append(self._contourColors[-1])

            lut = vtk.vtkLookupTable()
            lut.SetNumberOfTableValues(numLevels)
            for i in range(numLevels):
                r, g, b = self._colorMap.index[self._contourColors[i]]
                lut.SetTableValue(i, r / 100., g / 100., b / 100.)

            mapper.SetLookupTable(lut)
            if numpy.allclose(self._contourLevels[0], -1.e20):
                lmn = self._min - 1.
            else:
                lmn = self._contourLevels[0]
            if numpy.allclose(self._contourLevels[-1], 1.e20):
                lmx = self._max + 1.
            else:
                lmx = self._contourLevels[-1]
            mapper.SetScalarRange(lmn, lmx)
            self._resultDict["vtk_backend_luts"] = [[lut, [lmn, lmx, True]]]

        if self._maskedDataMapper is not None:
            mappers.insert(0, self._maskedDataMapper)

        x1, x2, y1, y2 = vcs.utils.getworldcoordinates(self._gm,
                                                       self._data1.getAxis(-1),
                                                       self._data1.getAxis(-2))

        # And now we need actors to actually render this thing
        actors = []
        for mapper in mappers:
            act = vtk.vtkActor()
            act.SetMapper(mapper)

            if self._vtkGeoTransform is None:
                # If using geofilter on wireframed does not get wrppaed not
                # sure why so sticking to many mappers
                act = vcs2vtk.doWrap(act, [x1, x2, y1, y2],
                                     self._dataWrapModulo)

            # TODO see comment in boxfill.
            if mapper is self._maskedDataMapper:
                actors.append([act, self._maskedDataMapper, [x1, x2, y1, y2]])
            else:
                actors.append([act, [x1, x2, y1, y2]])

            # create a new renderer for this mapper
            # (we need one for each mapper because of cmaera flips)
            self._context().fitToViewport(
                act, [self._template.data.x1, self._template.data.x2,
                      self._template.data.y1, self._template.data.y2],
                wc=[x1, x2, y1, y2], geo=self._vtkGeoTransform,
                priority=self._template.data.priority,
                create_renderer=True)

        self._resultDict["vtk_backend_actors"] = actors

        t = self._originalData1.getTime()
        if self._originalData1.ndim > 2:
            z = self._originalData1.getAxis(-3)
        else:
            z = None

        self._resultDict.update(self._context().renderTemplate(self._template,
                                                               self._data1,
                                                               self._gm, t, z))

        legend = getattr(self._gm, "legend", None)

        if self._gm.ext_1:
            if isinstance(self._contourLevels[0], list):
                if numpy.less(abs(self._contourLevels[0][0]), 1.e20):
                    # Ok we need to add the ext levels
                    self._contourLevels.insert(0, [-1.e20, self._contourLevels[0][0]])
            else:
                if numpy.less(abs(self._contourLevels[0]), 1.e20):
                    # need to add an ext
                    self._contourLevels.insert(0, -1.e20)
        if self._gm.ext_2:
            if isinstance(self._contourLevels[-1], list):
                if numpy.less(abs(self._contourLevels[-1][1]), 1.e20):
                    # need ext
                    self._contourLevels.append([self._contourLevels[-1][1],
                                                1.e20])
            else:
                if numpy.less(abs(self._contourLevels[-1]), 1.e20):
                    # need exts
                    self._contourLevels.append(1.e20)

        self._resultDict.update(
            self._context().renderColorBar(self._template, self._contourLevels,
                                           self._contourColors, legend,
                                           self._colorMap))

        if self._context().canvas._continents is None:
            self._useContinents = False
        if self._useContinents:
            projection = vcs.elements["projection"][self._gm.projection]
            self._context().plotContinents(x1, x2, y1, y2, projection,
                                           self._dataWrapModulo,
                                           self._template)
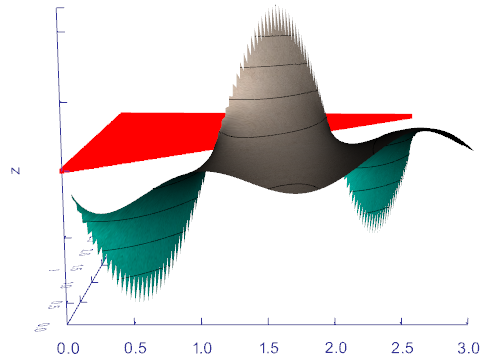
def fxy(z='sin(3*x)*log(x-y)/3',
        x=[0, 3],
        y=[0, 3],
        zlimits=[None, None],
        showNan=True,
        zlevels=10,
        wire=False,
        c='b',
        bc='aqua',
        alpha=1,
        legend=True,
        texture=None,
        res=100):
    '''
    Build a surface representing the 3D function specified as a string
    or as a reference to an external function.
    Red points indicate where the function does not exist (showNan).

    zlevels will draw the specified number of z-levels contour lines.

    Examples:
        vp = plotter.vtkPlotter()
        vp.fxy('sin(3*x)*log(x-y)/3')
        or
        def z(x,y): return math.sin(x*y)
        vp.fxy(z) # or equivalently:
        vp.fxy(lambda x,y: math.sin(x*y))
    '''
    if isinstance(z, str):
        try:
            z = z.replace('math.', '').replace('np.', '')
            namespace = locals()
            code = "from math import*\ndef zfunc(x,y): return " + z
            exec(code, namespace)
            z = namespace['zfunc']
        except:
            vio.printc('Syntax Error in fxy()', 1)
            return None

    ps = vtk.vtkPlaneSource()
    ps.SetResolution(res, res)
    ps.SetNormal([0, 0, 1])
    ps.Update()
    poly = ps.GetOutput()
    dx = x[1] - x[0]
    dy = y[1] - y[0]
    todel, nans = [], []

    if zlevels:
        tf = vtk.vtkTriangleFilter()
        vu.setInput(tf, poly)
        tf.Update()
        poly = tf.GetOutput()

    for i in range(poly.GetNumberOfPoints()):
        px, py, _ = poly.GetPoint(i)
        xv = (px + .5) * dx + x[0]
        yv = (py + .5) * dy + y[0]
        try:
            zv = z(xv, yv)
            poly.GetPoints().SetPoint(i, [xv, yv, zv])
        except:
            todel.append(i)
            nans.append([xv, yv, 0])

    if len(todel):
        cellIds = vtk.vtkIdList()
        poly.BuildLinks()

        for i in todel:
            poly.GetPointCells(i, cellIds)
            for j in range(cellIds.GetNumberOfIds()):
                poly.DeleteCell(cellIds.GetId(j))  #flag cell

        poly.RemoveDeletedCells()
        cl = vtk.vtkCleanPolyData()
        vu.setInput(cl, poly)
        cl.Update()
        poly = cl.GetOutput()

    if not poly.GetNumberOfPoints():
        vio.printc('Function is not real in the domain', 1)
        return vtk.vtkActor()

    if zlimits[0]:
        a = cutPlane(poly, (0, 0, zlimits[0]), (0, 0, 1), False)
        poly = vu.polydata(a)
    if zlimits[1]:
        a = cutPlane(poly, (0, 0, zlimits[1]), (0, 0, -1), False)
        poly = vu.polydata(a)

    if c is None:
        elev = vtk.vtkElevationFilter()
        vu.setInput(elev, poly)
        elev.Update()
        poly = elev.GetOutput()

    actor = vu.makeActor(poly,
                         c=c,
                         bc=bc,
                         alpha=alpha,
                         wire=wire,
                         legend=legend,
                         texture=texture)
    acts = [actor]
    if zlevels:
        elevation = vtk.vtkElevationFilter()
        vu.setInput(elevation, poly)
        bounds = poly.GetBounds()
        elevation.SetLowPoint(0, 0, bounds[4])
        elevation.SetHighPoint(0, 0, bounds[5])
        elevation.Update()
        bcf = vtk.vtkBandedPolyDataContourFilter()
        vu.setInput(bcf, elevation.GetOutput())
        bcf.SetScalarModeToValue()
        bcf.GenerateContourEdgesOn()
        bcf.GenerateValues(zlevels, elevation.GetScalarRange())
        bcf.Update()
        zpoly = bcf.GetContourEdgesOutput()
        zbandsact = vu.makeActor(zpoly, c='k', alpha=alpha)
        zbandsact.GetProperty().SetLineWidth(1.5)
        acts.append(zbandsact)

    if showNan and len(todel):
        bb = actor.GetBounds()
        zm = (bb[4] + bb[5]) / 2
        nans = np.array(nans) + [0, 0, zm]
        nansact = vs.points(nans, c='red', alpha=alpha / 2)
        acts.append(nansact)

    if len(acts) > 1:
        asse = vu.makeAssembly(acts)
        return asse
    else:
        return actor
def DisplaySurface(st):
    """
    Make and display the surface.
    :param: st - the surface to display.
    :return The vtkRenderWindowInteractor.
    """
    surface = st.upper()
    if not (surface in SURFACE_TYPE):
        print(st, 'is not a surface.')
        iren = vtk.vtkRenderWindowInteractor()
        return iren

    colors = vtk.vtkNamedColors()

    # Set the background color.
    colors.SetColor('BkgColor', [179, 204, 255, 255])

    # ------------------------------------------------------------
    # Create the surface, lookup tables, contour filter etc.
    # ------------------------------------------------------------
    src = vtk.vtkPolyData()
    if surface == 'TORUS':
        src = MakeTorus()
    elif surface == 'PARAMETRIC_TORUS':
        src = MakeParametricTorus()
    elif surface == 'PARAMETRIC_HILLS':
        src = Clipper(MakeParametricHills(), 0.5, 0.5, 0.0)
    # Here we are assuming that the active scalars are the curvatures.
    curvatureName = src.GetPointData().GetScalars().GetName()
    # Use this range to color the glyphs for the normals by elevation.
    src.GetPointData().SetActiveScalars('Elevation')
    scalarRangeElevation = src.GetScalarRange()
    src.GetPointData().SetActiveScalars(curvatureName)
    scalarRangeCurvatures = src.GetScalarRange()
    scalarRange = scalarRangeCurvatures

    lut = MakeLUT()
    numberOfBands = lut.GetNumberOfTableValues()
    bands = MakeBands(scalarRange, numberOfBands, False)
    if surface == 'PARAMETRIC_HILLS':
        # Comment this out if you want to see how allocating
        # equally spaced bands works.
        bands = MakeCustomBands(scalarRange, numberOfBands)
        # Adjust the number of table values
        numberOfBands = len(bands)
        lut.SetNumberOfTableValues(numberOfBands)

    lut.SetTableRange(scalarRange)

    # We will use the midpoint of the band as the label.
    labels = []
    for i in range(numberOfBands):
        labels.append('{:4.2f}'.format(bands[i][1]))

    # Annotate
    values = vtk.vtkVariantArray()
    for i in range(len(labels)):
        values.InsertNextValue(vtk.vtkVariant(labels[i]))
    for i in range(values.GetNumberOfTuples()):
        lut.SetAnnotation(i, values.GetValue(i).ToString())

    # Create a lookup table with the colors reversed.
    lutr = ReverseLUT(lut)

    # Create the contour bands.
    bcf = vtk.vtkBandedPolyDataContourFilter()
    bcf.SetInputData(src)
    # Use either the minimum or maximum value for each band.
    for i in range(0, numberOfBands):
        bcf.SetValue(i, bands[i][2])
    # We will use an indexed lookup table.
    bcf.SetScalarModeToIndex()
    bcf.GenerateContourEdgesOn()

    # Generate the glyphs on the original surface.
    glyph = MakeGlyphs(src, False)

    # ------------------------------------------------------------
    # Create the mappers and actors
    # ------------------------------------------------------------
    srcMapper = vtk.vtkPolyDataMapper()
    srcMapper.SetInputConnection(bcf.GetOutputPort())
    srcMapper.SetScalarRange(scalarRange)
    srcMapper.SetLookupTable(lut)
    srcMapper.SetScalarModeToUseCellData()

    srcActor = vtk.vtkActor()
    srcActor.SetMapper(srcMapper)
    srcActor.RotateX(-45)
    srcActor.RotateZ(45)

    # Create contour edges
    edgeMapper = vtk.vtkPolyDataMapper()
    edgeMapper.SetInputData(bcf.GetContourEdgesOutput())
    edgeMapper.SetResolveCoincidentTopologyToPolygonOffset()

    edgeActor = vtk.vtkActor()
    edgeActor.SetMapper(edgeMapper)
    edgeActor.GetProperty().SetColor(colors.GetColor3d('Black'))
    edgeActor.RotateX(-45)
    edgeActor.RotateZ(45)

    glyphMapper = vtk.vtkPolyDataMapper()
    glyphMapper.SetInputConnection(glyph.GetOutputPort())
    glyphMapper.SetScalarModeToUsePointFieldData()
    glyphMapper.SetColorModeToMapScalars()
    glyphMapper.ScalarVisibilityOn()
    glyphMapper.SelectColorArray('Elevation')
    # Colour by scalars.
    glyphMapper.SetScalarRange(scalarRangeElevation)

    glyphActor = vtk.vtkActor()
    glyphActor.SetMapper(glyphMapper)
    glyphActor.RotateX(-45)
    glyphActor.RotateZ(45)

    # Add a scalar bar.
    scalarBar = vtk.vtkScalarBarActor()
    # This LUT puts the lowest value at the top of the scalar bar.
    # scalarBar->SetLookupTable(lut);
    # Use this LUT if you want the highest value at the top.
    scalarBar.SetLookupTable(lutr)
    scalarBar.SetTitle('Gaussian\nCurvature')

    # ------------------------------------------------------------
    # Create the RenderWindow, Renderer and Interactor
    # ------------------------------------------------------------
    ren = vtk.vtkRenderer()
    renWin = vtk.vtkRenderWindow()
    iren = vtk.vtkRenderWindowInteractor()

    renWin.AddRenderer(ren)
    iren.SetRenderWindow(renWin)

    # add actors
    ren.AddViewProp(srcActor)
    ren.AddViewProp(edgeActor)
    ren.AddViewProp(glyphActor)
    ren.AddActor2D(scalarBar)

    ren.SetBackground(colors.GetColor3d('BkgColor'))
    renWin.SetSize(800, 800)
    renWin.SetWindowName('CurvatureBandsWithGlyphs')

    renWin.Render()

    ren.GetActiveCamera().Zoom(1.5)

    return iren
    def CreateVtkMapperActor(self):

        self.surfMapper = vtk.vtkPolyDataMapper()

        self.surfMapper.SetInputData(self.vtkSurfPolyData)
        self.surfActor = vtk.vtkActor()
        self.surfActor.SetMapper(self.surfMapper)
        self.surfActor.GetProperty().SetLineWidth(2.0)
        self.surfActor.GetProperty().SetPointSize(8.0)

        self.contMapper = vtk.vtkPolyDataMapper()
        scalarRange = self.vtkContPolyData.GetScalarRange()
        if scalarRange[0] > scalarRange[1]:
            scalarRange = (0, 1)

        self.contMapper.SetScalarRange(scalarRange)

        lut = MakeLUT()
        # lut.SetNumberOfTableValues(20)
        numberOfBands = lut.GetNumberOfTableValues()
        bands = MakeBands(scalarRange, numberOfBands, False)

        lut.SetTableRange(scalarRange)

        # We will use the midpoint of the band as the label.
        labels = []
        for i in range(numberOfBands):
            labels.append('{:4.2f}'.format(bands[i][1]))

        # Annotate
        values = vtk.vtkVariantArray()
        for i in range(len(labels)):
            values.InsertNextValue(vtk.vtkVariant(labels[i]))
        for i in range(values.GetNumberOfTuples()):
            lut.SetAnnotation(i, values.GetValue(i).ToString())

        # Create the contour bands.
        bcf = vtk.vtkBandedPolyDataContourFilter()
        bcf.SetInputData(self.vtkContPolyData)
        # Use either the minimum or maximum value for each band.
        for i in range(0, numberOfBands):
            bcf.SetValue(i, bands[i][2])
        # We will use an indexed lookup table.
        bcf.SetScalarModeToIndex()
        bcf.GenerateContourEdgesOn()

        self.contMapper.SetInputConnection(bcf.GetOutputPort())
        self.contMapper.SetScalarRange(scalarRange)
        self.contMapper.SetLookupTable(lut)
        self.contMapper.SetScalarModeToUseCellData()

        self.contActor = vtk.vtkActor()
        self.contActor.SetMapper(self.contMapper)
        self.contActor.VisibilityOff()

        self.edgeMapper = vtk.vtkPolyDataMapper()
        self.edgeMapper.SetInputData(self.vtkEdgePolyData)
        self.edgeActor = vtk.vtkActor()
        self.edgeActor.SetMapper(self.edgeMapper)
        self.edgeActor.GetProperty().SetRepresentationToWireframe()
        self.edgeActor.GetProperty().SetColor([0, 0, 0])
        self.edgeActor.GetProperty().SetLineWidth(2.0)

        self.edgeActor.VisibilityOff()

        # Source for the glyph filter
        self.CreateArrowsGlyphs()

        self.glyphMapper = vtk.vtkPolyDataMapper()
        self.glyphMapper.SetInputConnection(self.glyph.GetOutputPort())
        self.glyphMapper.SetScalarModeToUsePointFieldData()
        # self.glyphMapper.SetColorModeToMapScalars()
        self.glyphMapper.ScalarVisibilityOn()
        # self.glyphMapper.SelectColorArray('vecMag')
        # Colour by scalars.
        # scalarRange = polydata.GetScalerRange()
        # glyphMapper.SetScalarRange(scalarRange)

        self.glyphActor = vtk.vtkActor()
        self.glyphActor.GetProperty().SetColor(0.3, 0.3, 0.0)
        self.glyphActor.SetMapper(self.glyphMapper)
    def _plotInternal(self):
        """Overrides baseclass implementation."""

        preppedCountours = self._prepContours()
        tmpLevels = preppedCountours["tmpLevels"]
        tmpIndices = preppedCountours["tmpIndices"]
        tmpColors = preppedCountours["tmpColors"]
        tmpOpacities = preppedCountours["tmpOpacities"]
        style = self._gm.fillareastyle

        luts = []
        cots = []
        mappers = []
        _colorMap = self.getColorMap()

        plotting_dataset_bounds = self.getPlottingBounds()
        x1, x2, y1, y2 = plotting_dataset_bounds

        for i, l in enumerate(tmpLevels):
            # Ok here we are trying to group together levels can be, a join
            # will happen if: next set of levels continues where one left off
            # AND pattern is identical
            mapper = vtk.vtkPolyDataMapper()
            lut = vtk.vtkLookupTable()
            cot = vtk.vtkBandedPolyDataContourFilter()
            cot.ClippingOn()
            cot.SetInputData(self._vtkPolyDataFilter.GetOutput())
            cot.SetNumberOfContours(len(l))
            cot.SetClipTolerance(0.)
            for j, v in enumerate(l):
                cot.SetValue(j, v)
            cot.Update()

            cots.append(cot)
            mapper.SetInputConnection(cot.GetOutputPort())
            lut.SetNumberOfTableValues(len(tmpColors[i]))
            for j, color in enumerate(tmpColors[i]):
                r, g, b, a = self.getColorIndexOrRGBA(_colorMap, color)
                if style == 'solid':
                    tmpOpacity = tmpOpacities[j]
                    if tmpOpacity is None:
                        tmpOpacity = a / 100.
                    else:
                        tmpOpacity = tmpOpacities[j] / 100.
                    lut.SetTableValue(j, r / 100., g / 100., b / 100.,
                                      tmpOpacity)
                else:
                    lut.SetTableValue(j, 1., 1., 1., 0.)
            luts.append([lut, [0, len(l) - 1, True]])
            mapper.SetLookupTable(lut)
            minRange = 0
            maxRange = len(l) - 1
            if (i == 0 and self._scalarRange[0] < l[0]):
                # band 0 is from self._scalarRange[0] to l[0]
                # we don't show band 0
                minRange += 1
            mapper.SetScalarRange(minRange, maxRange)
            mapper.SetScalarModeToUseCellData()
            mappers.append(mapper)

        self._resultDict["vtk_backend_luts"] = luts
        if len(cots) > 0:
            self._resultDict["vtk_backend_contours"] = cots

        numLevels = len(self._contourLevels)
        if mappers == []:  # ok didn't need to have special banded contours
            mapper = vtk.vtkPolyDataMapper()
            mappers = [mapper]
            # Colortable bit
            # make sure length match
            while len(self._contourColors) < len(self._contourLevels):
                self._contourColors.append(self._contourColors[-1])

            lut = vtk.vtkLookupTable()
            lut.SetNumberOfTableValues(numLevels)
            for i in range(numLevels):
                r, g, b, a = self.getColorIndexOrRGBA(_colorMap,
                                                      self._contourColors[i])
                lut.SetTableValue(i, r / 100., g / 100., b / 100., a / 100.)

            mapper.SetLookupTable(lut)
            if numpy.allclose(self._contourLevels[0], -1.e20):
                lmn = self._min - 1.
            else:
                lmn = self._contourLevels[0]
            if numpy.allclose(self._contourLevels[-1], 1.e20):
                lmx = self._max + 1.
            else:
                lmx = self._contourLevels[-1]
            mapper.SetScalarRange(lmn, lmx)
            self._resultDict["vtk_backend_luts"] = [[lut, [lmn, lmx, True]]]

        if self._maskedDataMapper is not None:
            mappers.insert(0, self._maskedDataMapper)

        # And now we need actors to actually render this thing
        actors = []
        patternActors = []
        ct = 0
        vp = self._resultDict.get('ratio_autot_viewport', [
            self._template.data.x1, self._template.data.x2,
            self._template.data.y1, self._template.data.y2
        ])
        dataset_renderer = None
        xScale, yScale = (1, 1)
        for mapper in mappers:
            act = vtk.vtkActor()
            act.SetMapper(mapper)

            patact = None
            # TODO see comment in boxfill.
            if mapper is self._maskedDataMapper:
                actors.append(
                    [act, self._maskedDataMapper, plotting_dataset_bounds])
            else:
                actors.append([act, plotting_dataset_bounds])

                # Since pattern creation requires a single color, assuming the first
                c = self.getColorIndexOrRGBA(_colorMap, tmpColors[ct][0])

                # The isofill actor is scaled by the camera, so we need to use this size
                # instead of window size for scaling the pattern.
                viewsize = (x2 - x1, y2 - y1)
                patact = fillareautils.make_patterned_polydata(
                    mapper.GetInput(),
                    fillareastyle=style,
                    fillareaindex=tmpIndices[ct],
                    fillareacolors=c,
                    fillareaopacity=tmpOpacities[ct],
                    size=viewsize)

                if patact is not None:
                    patternActors.append(patact)

                # increment the count
                ct += 1

            # create a new renderer for this mapper
            # (we need one for each mapper because of cmaera flips)
            dataset_renderer, xScale, yScale = self._context().fitToViewport(
                act,
                vp,
                wc=plotting_dataset_bounds,
                geoBounds=self._vtkDataSetBoundsNoMask,
                geo=self._vtkGeoTransform,
                priority=self._template.data.priority,
                create_renderer=(mapper is self._maskedDataMapper
                                 or dataset_renderer is None))
        for act in patternActors:
            self._context().fitToViewport(
                act,
                vp,
                wc=plotting_dataset_bounds,
                geoBounds=self._vtkDataSetBoundsNoMask,
                geo=self._vtkGeoTransform,
                priority=self._template.data.priority,
                create_renderer=True)
            actors.append([act, plotting_dataset_bounds])

        self._resultDict["vtk_backend_actors"] = actors

        t = self._originalData1.getTime()
        if self._originalData1.ndim > 2:
            z = self._originalData1.getAxis(-3)
        else:
            z = None
        kwargs = {
            "vtk_backend_grid": self._vtkDataSet,
            "dataset_bounds": self._vtkDataSetBounds,
            "plotting_dataset_bounds": plotting_dataset_bounds,
            "vtk_dataset_bounds_no_mask": self._vtkDataSetBoundsNoMask,
            "vtk_backend_geo": self._vtkGeoTransform
        }
        if ("ratio_autot_viewport" in self._resultDict):
            kwargs["ratio_autot_viewport"] = vp
        self._resultDict.update(self._context().renderTemplate(
            self._template, self._data1, self._gm, t, z, **kwargs))
        legend = getattr(self._gm, "legend", None)

        if self._gm.ext_1:
            if isinstance(self._contourLevels[0], list):
                if numpy.less(abs(self._contourLevels[0][0]), 1.e20):
                    # Ok we need to add the ext levels
                    self._contourLevels.insert(
                        0, [-1.e20, self._contourLevels[0][0]])
            else:
                if numpy.less(abs(self._contourLevels[0]), 1.e20):
                    # need to add an ext
                    self._contourLevels.insert(0, -1.e20)
        if self._gm.ext_2:
            if isinstance(self._contourLevels[-1], list):
                if numpy.less(abs(self._contourLevels[-1][1]), 1.e20):
                    # need ext
                    self._contourLevels.append(
                        [self._contourLevels[-1][1], 1.e20])
            else:
                if numpy.less(abs(self._contourLevels[-1]), 1.e20):
                    # need exts
                    self._contourLevels.append(1.e20)

        self._resultDict.update(self._context().renderColorBar(
            self._template,
            self._contourLevels,
            self._contourColors,
            legend,
            self.getColorMap(),
            style=style,
            index=self._gm.fillareaindices,
            opacity=self._gm.fillareaopacity))

        if self._context().canvas._continents is None:
            self._useContinents = False
        if self._useContinents:
            projection = vcs.elements["projection"][self._gm.projection]
            continents_renderer, xScale, yScale = self._context(
            ).plotContinents(plotting_dataset_bounds, projection,
                             self._dataWrapModulo, vp,
                             self._template.data.priority, **kwargs)
def DisplayCone(nc):
    '''
    Create a cone, contour it using the banded contour filter and
        color it with the primary additive and subtractive colors.
    :param: nc: The vtkNamedColor class
    :return: The render window interactor.
    '''
    # Create a cone
    coneSource = vtk.vtkConeSource()
    coneSource.SetCenter(0.0, 0.0, 0.0)
    coneSource.SetRadius(5.0)
    coneSource.SetHeight(10)
    coneSource.SetDirection(0, 1, 0)
    coneSource.Update()

    bounds = [1.0, -1.0, 1.0, -1.0, 1.0, -1.0]
    coneSource.GetOutput().GetBounds(bounds)

    elevation = vtk.vtkElevationFilter()
    elevation.SetInputConnection(coneSource.GetOutputPort())
    elevation.SetLowPoint(0, bounds[2], 0)
    elevation.SetHighPoint(0, bounds[3], 0)

    bcf = vtk.vtkBandedPolyDataContourFilter()
    bcf.SetInputConnection(elevation.GetOutputPort())
    bcf.SetScalarModeToValue()
    bcf.GenerateContourEdgesOn()
    bcf.GenerateValues(7, elevation.GetScalarRange())

    # Build a simple lookup table of
    # primary additive and subtractive colors.
    lut = vtk.vtkLookupTable()
    lut.SetNumberOfTableValues(7)
    # Test setting and getting a color here.
    # We are also modifying alpha.

    # Convert to a list so that
    # SetColor(name,rgba) works.
    rgba = list(nc.GetColor4d("Red"))
    rgba[3] = 0.5
    nc.SetColor("My Red", rgba)
    rgba = nc.GetColor4d("My Red")
    lut.SetTableValue(0, rgba)
    # Does "My Red" match anything?
    match = FindSynonyms(nc, "My Red")
    print("Matching colors to My Red:", match)

    rgba = nc.GetColor4d("DarkGreen")
    rgba[3] = 0.3
    lut.SetTableValue(1, rgba)
    #  Alternatively we can use our wrapper functions:
    lut.SetTableValue(2, nc.GetColor4d("Blue"))
    lut.SetTableValue(3, nc.GetColor4d("Cyan"))
    lut.SetTableValue(4, nc.GetColor4d("Magenta"))
    lut.SetTableValue(5, nc.GetColor4d("Yellow"))
    lut.SetTableValue(6, nc.GetColor4d("White"))
    lut.SetTableRange(elevation.GetScalarRange())
    lut.Build()

    mapper = vtk.vtkPolyDataMapper()
    mapper.SetInputConnection(bcf.GetOutputPort())
    mapper.SetLookupTable(lut)
    mapper.SetScalarModeToUseCellData()

    contourLineMapper = vtk.vtkPolyDataMapper()
    contourLineMapper.SetInputData(bcf.GetContourEdgesOutput())
    contourLineMapper.SetScalarRange(elevation.GetScalarRange())
    contourLineMapper.SetResolveCoincidentTopologyToPolygonOffset()

    actor = vtk.vtkActor()
    actor.SetMapper(mapper)

    contourLineActor = vtk.vtkActor()
    actor.SetMapper(mapper)
    contourLineActor.SetMapper(contourLineMapper)
    contourLineActor.GetProperty().SetColor(nc.GetColor3d("black"))

    renderer = vtk.vtkRenderer()
    renderWindow = vtk.vtkRenderWindow()
    renderWindow.AddRenderer(renderer)
    renderWindowInteractor = vtk.vtkRenderWindowInteractor()
    renderWindowInteractor.SetRenderWindow(renderWindow)

    renderer.AddActor(actor)
    renderer.AddActor(contourLineActor)
    renderer.SetBackground(nc.GetColor3d("SteelBlue"))

    renderWindow.Render()

    fnsave = "TestNamedColorsIntegration.png"
    renLgeIm = vtk.vtkRenderLargeImage()
    imgWriter = vtk.vtkPNGWriter()
    renLgeIm.SetInput(renderer)
    renLgeIm.SetMagnification(1)
    imgWriter.SetInputConnection(renLgeIm.GetOutputPort())
    imgWriter.SetFileName(fnsave)
    # imgWriter.Write()

    return renderWindowInteractor
def main():
    # Basic stuff setup
    # Set up the renderer, window, and interactor
    colors = vtk.vtkNamedColors()

    ren = vtk.vtkRenderer()
    renWin = vtk.vtkRenderWindow()
    renWin.AddRenderer(ren)
    renWin.SetSize(640, 480)
    iRen = vtk.vtkRenderWindowInteractor()
    iRen.SetRenderWindow(renWin)

    # Create a cone with an elliptical base whose major axis is in the
    # X-direction.
    coneSource = vtk.vtkConeSource()
    coneSource.SetCenter(0.0, 0.0, 0.0)
    coneSource.SetRadius(5.0)
    coneSource.SetHeight(15.0)
    coneSource.SetDirection(0, 1, 0)
    coneSource.SetResolution(60)
    coneSource.Update()

    transform = vtk.vtkTransform()
    transform.Scale(1.0, 1.0, 0.75)

    transF = vtk.vtkTransformPolyDataFilter()
    transF.SetInputConnection(coneSource.GetOutputPort())
    transF.SetTransform(transform)

    bounds = transF.GetOutput().GetBounds()

    elevation = vtk.vtkElevationFilter()
    elevation.SetInputConnection(transF.GetOutputPort())
    elevation.SetLowPoint(0, bounds[2], 0)
    elevation.SetHighPoint(0, bounds[3], 0)

    bandedContours = vtk.vtkBandedPolyDataContourFilter()
    bandedContours.SetInputConnection(elevation.GetOutputPort())
    bandedContours.SetScalarModeToValue()
    bandedContours.GenerateContourEdgesOn()
    bandedContours.GenerateValues(11, elevation.GetScalarRange())

    # Make a lookup table using a color series.
    colorSeries = vtk.vtkColorSeries()
    colorSeries.SetColorScheme(vtk.vtkColorSeries.BREWER_DIVERGING_SPECTRAL_11)

    lut = vtk.vtkLookupTable()
    colorSeries.BuildLookupTable(lut, vtk.vtkColorSeries.ORDINAL)

    coneMapper = vtk.vtkPolyDataMapper()
    coneMapper.SetInputConnection(bandedContours.GetOutputPort())
    coneMapper.SetScalarRange(elevation.GetScalarRange())
    coneMapper.SetLookupTable(lut)

    coneActor = vtk.vtkActor()
    coneActor.SetMapper(coneMapper)

    # Contouring
    contourLineMapper = vtk.vtkPolyDataMapper()
    contourLineMapper.SetInputData(bandedContours.GetContourEdgesOutput())
    contourLineMapper.SetScalarRange(elevation.GetScalarRange())
    contourLineMapper.SetResolveCoincidentTopologyToPolygonOffset()

    contourLineActor = vtk.vtkActor()
    contourLineActor.SetMapper(contourLineMapper)
    contourLineActor.GetProperty().SetColor(colors.GetColor3d('DimGray'))

    # Set up the Orientation Marker Widget.
    prop_assembly = MakeAnnotatedCubeActor(colors)
    om1 = vtk.vtkOrientationMarkerWidget()
    om1.SetOrientationMarker(prop_assembly)
    om1.SetInteractor(iRen)
    om1.SetDefaultRenderer(ren)
    om1.On()
    om1.InteractiveOn()

    xyzLabels = ['X', 'Y', 'Z']
    scale = [1.0, 1.0, 1.0]
    axes = MakeAxesActor(scale, xyzLabels)

    om2 = vtk.vtkOrientationMarkerWidget()
    om2.SetOrientationMarker(axes)
    # Position lower right in the viewport.
    om2.SetViewport(0.8, 0, 1.0, 0.2)
    om2.SetInteractor(iRen)
    om2.EnabledOn()
    om2.InteractiveOn()

    ren.AddActor(coneActor)
    ren.AddActor(contourLineActor)
    ren.SetBackground2(colors.GetColor3d('RoyalBlue'))
    ren.SetBackground(colors.GetColor3d('MistyRose'))
    ren.GradientBackgroundOn()
    ren.GetActiveCamera().Azimuth(45)
    ren.GetActiveCamera().Pitch(-22.5)
    ren.ResetCamera()

    renWin.SetSize(600, 600)
    renWin.Render()
    renWin.SetWindowName('ColoredAnnotatedCube')
    renWin.Render()
    iRen.Start()
  def plot2D(self,data1,data2,tmpl,gm):
    ug,xm,xM,ym,yM,continents,wrap,geo,cellData = vcs2vtk.genGrid(data1,data2,gm)
    #Now applies the actual data on each cell
    if isinstance(gm,boxfill.Gfb) and gm.boxfill_type=="log10":
        data1=numpy.ma.log10(data1)
    data = VN.numpy_to_vtk(data1.filled(0.).flat,deep=True)
    if cellData:
        ug.GetCellData().SetScalars(data)
    else:
        ug.GetPointData().SetScalars(data)

    try:
      cmap = vcs.elements["colormap"][cmap]
    except:
      cmap = vcs.elements["colormap"][self.canvas.getcolormapname()]

    color = getattr(gm,"missing",None)
    if color is not None:
        color = cmap.index[color]
    missingMapper = vcs2vtk.putMaskOnVTKGrid(data1,ug,color,cellData)
    lut = vtk.vtkLookupTable()
    mn,mx=vcs.minmax(data1)
    #Ok now we have grid and data let's use the mapper
    mapper = vtk.vtkPolyDataMapper()
    legend = None
    if isinstance(gm,(meshfill.Gfm,boxfill.Gfb)):
      geoFilter = vtk.vtkDataSetSurfaceFilter()
      if cellData:
          p2c = vtk.vtkPointDataToCellData()
          p2c.SetInputData(ug)
          geoFilter.SetInputConnection(p2c.GetOutputPort())
      else:
        geoFilter.SetInputData(ug)
      geoFilter.Update()

    if isinstance(gm,(isofill.Gfi,isoline.Gi,meshfill.Gfm)) or \
        (isinstance(gm,boxfill.Gfb) and gm.boxfill_type=="custom"):

      #Now this filter seems to create the good polydata
      sFilter = vtk.vtkDataSetSurfaceFilter()
      if cellData:
          # Sets data to point instead of just cells
          c2p = vtk.vtkCellDataToPointData()
          c2p.SetInputData(ug)
          c2p.Update()
          if self.debug:
            vcs2vtk.dump2VTK(c2p)
          #For contouring duplicate points seem to confuse it
          if ug.IsA("vtkUntructuredGrid"):
              cln = vtk.vtkCleanUnstructuredGrid()
              cln.SetInputConnection(c2p.GetOutputPort())
              if self.debug:
                vcs2vtk.dump2VTK(cln)
              sFilter.SetInputConnection(cln.GetOutputPort())
          else:
              sFilter.SetInputConnection(c2p.GetOutputPort())
      else:
          sFilter.SetInputData(ug)
      sFilter.Update()
      if self.debug:
        vcs2vtk.dump2VTK(sFilter)
      if isinstance(gm,isoline.Gi):
        cot = vtk.vtkContourFilter()
        if cellData:
          cot.SetInputData(sFilter.GetOutput())
        else:
          cot.SetInputData(ug)


      levs = gm.levels
      if (isinstance(gm,isoline.Gi) and numpy.allclose( levs[0],[0.,1.e20])) or numpy.allclose(levs,1.e20):
        levs = vcs.mkscale(mn,mx)
        Ncolors = len(levs)
        if isinstance(gm,(isofill.Gfi,meshfill.Gfm)):
          levs2 = vcs.mkscale(mn,mx)
          levs=[]
          for i in range(len(levs2)-1):
            levs.append([levs2[i],levs2[i+1]])
      else:
        if isinstance(gm.levels[0],(list,tuple)):
          if isinstance(gm,isoline.Gi):
            levs = [x[0] for x in gm.levels]
          else:
            levs = gm.levels
        else:
          levs = []
          levs2=gm.levels
          if numpy.allclose(levs2[0],1.e20):
            levs2[0]=-1.e20
          for i in range(len(levs2)-1):
            levs.append([levs2[i],levs2[i+1]])
          if isinstance(gm,isoline.Gi):
            levs = levs2
      Nlevs=len(levs)
      Ncolors = Nlevs
      ## Figure out colors
      if isinstance(gm,boxfill.Gfb):
        cols = gm.fillareacolors
        if cols is None:
          cols = vcs.getcolors(levs2,split=0)
      elif isinstance(gm,(isofill.Gfi,meshfill.Gfm)):
        cols = gm.fillareacolors
        if cols==[1,]:
          cols = vcs.getcolors(levs2,split=0)
      elif isinstance(gm,isoline.Gi):
        cols = gm.linecolors

      if isinstance(gm,isoline.Gi):
        cot.SetNumberOfContours(Nlevs)
        if levs[0]==1.e20:
          levs[0]=-1.e20
        for i in range(Nlevs):
          cot.SetValue(i,levs[i])
        cot.SetValue(Nlevs,levs[-1])
        cot.Update()
        mapper.SetInputConnection(cot.GetOutputPort())
        mappers = []
      else:
        mappers = []
        LEVS = []
        INDX = []
        COLS = []
        indices = gm.fillareaindices
        if indices is None:
            indices=[1,]
        while len(indices)<len(cols):
            indices.append(indices[-1])
        for i,l in enumerate(levs):
            if i==0:
                C = [cols[i],]
                if numpy.allclose(levs[0][0],-1.e20):
                    ## ok it's an extension arrow
                    L=[mn-1.,levs[0][1]]
                else:
                    L = levs[i]
                I = [indices[i],]
            else:
                if l[0] == L[-1] and I[-1]==indices[i]:
                    # Ok same type lets keep going
                    if numpy.allclose(l[1],1.e20):
                        L.append(mx+1.)
                    else:
                        L.append(l[1])
                    C.append(cols[i])
                else: # ok we need new contouring
                    LEVS.append(L)
                    COLS.append(C)
                    INDX.append(I)
                    C = [cols[i],]
                    L = levs[i]
                    I = [indices[i],]
        LEVS.append(L)
        COLS.append(C)
        INDX.append(I)


        for i,l in enumerate(LEVS):
          # Ok here we are trying to group together levels can be, a join will happen if:
          # next set of levels contnues where one left off AND pattern is identical

          if isinstance(gm,isofill.Gfi):
              mapper = vtk.vtkPolyDataMapper()
              lut = vtk.vtkLookupTable()
              cot = vtk.vtkBandedPolyDataContourFilter()
              cot.ClippingOn()
              cot.SetInputData(sFilter.GetOutput())
              cot.SetNumberOfContours(len(l))
              for j,v in enumerate(l):
                  cot.SetValue(j,v)
              #cot.SetScalarModeToIndex()
              cot.Update()
              mapper.SetInputConnection(cot.GetOutputPort())
              lut.SetNumberOfTableValues(len(COLS[i]))
              for j,color in enumerate(COLS[i]):
                  r,g,b = cmap.index[color]
                  lut.SetTableValue(j,r/100.,g/100.,b/100.)
                  #print l[j],vcs.colors.rgb2str(r*2.55,g*2.55,b*2.55),l[j+1]
              mapper.SetLookupTable(lut)
              mapper.SetScalarRange(0,len(l)-1)
              mapper.SetScalarModeToUseCellData()
          else:
              for j,color in enumerate(COLS[i]):
                  mapper = vtk.vtkPolyDataMapper()
                  lut = vtk.vtkLookupTable()
                  th = vtk.vtkThreshold()
                  th.ThresholdBetween(l[j],l[j+1])
                  th.SetInputConnection(geoFilter.GetOutputPort())
                  geoFilter2 = vtk.vtkDataSetSurfaceFilter()
                  geoFilter2.SetInputConnection(th.GetOutputPort())
                  mapper.SetInputConnection(geoFilter2.GetOutputPort())
                  lut.SetNumberOfTableValues(1)
                  r,g,b = cmap.index[color]
                  lut.SetTableValue(0,r/100.,g/100.,b/100.)
                  mapper.SetLookupTable(lut)
                  mapper.SetScalarRange(l[j],l[j+1])
                  mappers.append([mapper,])

          #png = vtk.vtkPNGReader()
          #png.SetFileName("/git/uvcdat/Packages/vcs/Share/uvcdat_texture.png")
          #T=vtk.vtkTexture()
          #T.SetInputConnection(png.GetOutputPort())
          if isinstance(gm,isofill.Gfi):
              mappers.append([mapper,])

    else: #Boxfill (non custom)/Meshfill
      if isinstance(gm,boxfill.Gfb):
        if numpy.allclose(gm.level_1,1.e20) or numpy.allclose(gm.level_2,1.e20):
          levs = vcs.mkscale(mn,mx)
          legend = vcs.mklabels(levs)
          dx = (levs[-1]-levs[0])/(gm.color_2-gm.color_1+1)
          levs = numpy.arange(levs[0],levs[-1]+dx,dx)
        else:
          if gm.boxfill_type=="log10":
              levs = vcs.mkscale(numpy.ma.log10(gm.level_1),numpy.ma.log10(gm.level_2))
          else:
              levs = vcs.mkscale(gm.level_1,gm.level_2)
          legend = vcs.mklabels(levs)
          if gm.boxfill_type=="log10":
              for k in legend.keys():
                  legend[float(numpy.ma.log10(legend[k]))] = legend[k]
                  del(legend[k])
          dx = (levs[-1]-levs[0])/(gm.color_2-gm.color_1+1)
          levs = numpy.arange(levs[0],levs[-1]+dx,dx)

        cols = range(gm.color_1,gm.color_2+1)
      else:
        if numpy.allclose(gm.levels,1.e20):
          levs = vcs.mkscale(mn,mx)
        else:
          levs = gm.levels
          if numpy.allclose(levs[0],1.e20):
            levs[0]=-1.e20
        cols = gm.fillareacolors
        if cols==[1,]:
          cols = vcs.getcolors(levs)
      Nlevs = len(levs)
      Ncolors = Nlevs-1
      #Prep mapper
      mappers=[]
      mapper = vtk.vtkPolyDataMapper()
      thr = vtk.vtkThreshold()
      thr.SetInputConnection(geoFilter.GetOutputPort())
      if not gm.ext_1 in ["y",1,True]  and not gm.ext_2 in ["y",1,True] :
          thr.ThresholdBetween(levs[0],levs[-1])
      elif gm.ext_1 in ["y",1,True]  and not gm.ext_2 in ["y",1,True] :
          thr.ThresholdByLower(levs[-1])
      elif not gm.ext_1 in ["y",1,True]  and gm.ext_2 in ["y",1,True] :
          thr.ThresholdByUpper(levs[0])
      thr.Update()
      geoFilter2 = vtk.vtkDataSetSurfaceFilter()
      geoFilter2.SetInputConnection(thr.GetOutputPort())
      if gm.ext_1 in ["y",1,True]  and gm.ext_2 in ["y",1,True] :
          mapper.SetInputConnection(geoFilter.GetOutputPort())
      else:
          mapper.SetInputConnection(geoFilter2.GetOutputPort())

    if mappers == []: # ok didn't need to have special banded contours
      mappers=[mapper,]
      ## Colortable bit
      # make sure length match
      while len(cols)<Ncolors:
        cols.append(cols[-1])

      lut.SetNumberOfTableValues(Ncolors)
      for i in range(Ncolors):
        r,g,b = cmap.index[cols[i]]
        lut.SetTableValue(i,r/100.,g/100.,b/100.)

      mapper.SetLookupTable(lut)
      if numpy.allclose(levs[0],-1.e20):
        lmn = mn-1.
      else:
        lmn= levs[0]
      if numpy.allclose(levs[-1],1.e20):
        lmx = mx+1.
      else:
        lmx= levs[-1]
      mapper.SetScalarRange(lmn,lmx)

    if missingMapper is not None:
        mappers.insert(0,missingMapper)

    x1,x2,y1,y2 = vcs2vtk.getRange(gm,xm,xM,ym,yM)

    if tmpl.data.priority != 0:
      # And now we need actors to actually render this thing
      for mapper in mappers:
        act = vtk.vtkActor()
        if isinstance(mapper,list):
          act.SetMapper(mapper[0])
        else:
          mapper.Update()
          act.SetMapper(mapper)
        if geo is None:
          act = vcs2vtk.doWrap(act,[x1,x2,y1,y2],wrap)
        if isinstance(mapper,list):
          #act.GetMapper().ScalarVisibilityOff()
          #act.SetTexture(mapper[1])
          pass
        # create a new renderer for this mapper (we need one for each mapper because of cmaera flips)
        ren = vtk.vtkRenderer()
        self.renWin.AddRenderer(ren)
        self.setLayer(ren,tmpl.data.priority)
        ren.AddActor(act)
        vcs2vtk.fitToViewport(act,ren,[tmpl.data.x1,tmpl.data.x2,tmpl.data.y1,tmpl.data.y2],wc=[x1,x2,y1,y2],geo=geo)

    if isinstance(gm,meshfill.Gfm):
      tmpl.plot(self.canvas,data1,gm,bg=self.bg,X=numpy.arange(xm,xM*1.1,(xM-xm)/10.),Y=numpy.arange(ym,yM*1.1,(yM-ym)/10.))
    else:
      self.renderTemplate(tmpl,data1,gm)
    if isinstance(gm,(isofill.Gfi,meshfill.Gfm,boxfill.Gfb)):
      if getattr(gm,"legend",None) is not None:
        legend = gm.legend
      if gm.ext_1 in ["y",1,True] and not numpy.allclose(levs[0],1.e20):
          if isinstance(levs,numpy.ndarray):
              levs=levs.tolist()
          levs.insert(0,-1.e20)
      if gm.ext_2 in ["y",1,True] and not numpy.allclose(levs[0],1.e20):
          if isinstance(levs,numpy.ndarray):
              levs=levs.tolist()
          levs.append(1.e20)

      self.renderColorBar(tmpl,levs,cols,legend,cmap)
    if self.canvas._continents is None:
      continents = False
    if continents:
        projection = vcs.elements["projection"][gm.projection]
        self.plotContinents(x1,x2,y1,y2,projection,wrap,tmpl)
def main():
    nc = vtk.vtkNamedColors()
    # We can print out the variables.
    # The color name and RGBA values are displayed.
    print(nc)

    # Here we just print out the colors and any
    # synonyms.
    PrintColors(nc)
    PrintSynonyms(nc)

    """
    Create a cone, contour it using the banded contour filter and
        color it with the primary additive and subtractive colors.
    """
    # Create a cone
    coneSource = vtk.vtkConeSource()
    coneSource.SetCenter(0.0, 0.0, 0.0)
    coneSource.SetRadius(5.0)
    coneSource.SetHeight(10)
    coneSource.SetDirection(0, 1, 0)
    coneSource.SetResolution(6)
    coneSource.Update()

    bounds = [1.0, -1.0, 1.0, -1.0, 1.0, -1.0]
    coneSource.GetOutput().GetBounds(bounds)

    elevation = vtk.vtkElevationFilter()
    elevation.SetInputConnection(coneSource.GetOutputPort())
    elevation.SetLowPoint(0, bounds[2], 0)
    elevation.SetHighPoint(0, bounds[3], 0)

    bcf = vtk.vtkBandedPolyDataContourFilter()
    bcf.SetInputConnection(elevation.GetOutputPort())
    bcf.SetScalarModeToValue()
    bcf.GenerateContourEdgesOn()
    bcf.GenerateValues(7, elevation.GetScalarRange())

    # Test setting and getting a color here.
    # We are also modifying alpha.
    # Convert to a list so that
    # SetColor(name,rgba) works.
    rgba = list(nc.GetColor4d("Red"))
    rgba[3] = 0.5
    nc.SetColor("My Red", rgba)
    # Does "My Red" match anything?
    match = FindSynonyms(nc, "My Red")
    print("Matching colors to My Red:", ', '.join(match))
    # Build a simple lookup table of
    # primary additive and subtractive colors.
    lut = vtk.vtkLookupTable()
    lut.SetNumberOfTableValues(7)
    lut.SetTableValue(0, nc.GetColor4d("My Red"))
    # Let's make the dark green one partially transparent.
    rgba = nc.GetColor4d("Lime")
    rgba[3] = 0.3
    lut.SetTableValue(1, rgba)
    lut.SetTableValue(2, nc.GetColor4d("Blue"))
    lut.SetTableValue(3, nc.GetColor4d("Cyan"))
    lut.SetTableValue(4, nc.GetColor4d("Magenta"))
    lut.SetTableValue(5, nc.GetColor4d("Yellow"))
    lut.SetTableValue(6, nc.GetColor4d("White"))
    lut.SetTableRange(elevation.GetScalarRange())
    lut.Build()

    mapper = vtk.vtkPolyDataMapper()
    mapper.SetInputConnection(bcf.GetOutputPort())
    mapper.SetLookupTable(lut)
    mapper.SetScalarModeToUseCellData()

    contourLineMapper = vtk.vtkPolyDataMapper()
    contourLineMapper.SetInputData(bcf.GetContourEdgesOutput())
    contourLineMapper.SetScalarRange(elevation.GetScalarRange())
    contourLineMapper.SetResolveCoincidentTopologyToPolygonOffset()

    actor = vtk.vtkActor()
    actor.SetMapper(mapper)

    contourLineActor = vtk.vtkActor()
    actor.SetMapper(mapper)
    contourLineActor.SetMapper(contourLineMapper)
    contourLineActor.GetProperty().SetColor(
        nc.GetColor3d("black"))

    renderer = vtk.vtkRenderer()
    renderWindow = vtk.vtkRenderWindow()
    renderWindow.AddRenderer(renderer)
    renderWindowInteractor = vtk.vtkRenderWindowInteractor()
    renderWindowInteractor.SetRenderWindow(renderWindow)

    renderer.AddActor(actor)
    renderer.AddActor(contourLineActor)
    renderer.SetBackground2(nc.GetColor3d('RoyalBlue'))
    renderer.SetBackground(nc.GetColor3d('MistyRose'))
    renderer.GradientBackgroundOn()
    renderWindow.SetSize(600, 600)
    renderWindow.Render()
    renderWindow.SetWindowName('NamedColors')
    renderWindow.Render()
    renderWindow.Render()

    renderWindowInteractor.Start()
    def _plotInternal(self):
        """Overrides baseclass implementation."""
        preppedCountours = self._prepContours()
        tmpLevels = preppedCountours["tmpLevels"]
        tmpIndices = preppedCountours["tmpIndices"]
        tmpColors = preppedCountours["tmpColors"]
        tmpOpacities = preppedCountours["tmpOpacities"]
        style = self._gm.fillareastyle

        luts = []
        cots = []
        mappers = []
        _colorMap = self.getColorMap()

        plotting_dataset_bounds = self.getPlottingBounds()
        x1, x2, y1, y2 = plotting_dataset_bounds
        fareapixelspacing, fareapixelscale = self._patternSpacingAndScale()

        for i, l in enumerate(tmpLevels):
            # Ok here we are trying to group together levels can be, a join
            # will happen if: next set of levels continues where one left off
            # AND pattern is identical
            mapper = vtk.vtkPolyDataMapper()
            lut = vtk.vtkLookupTable()
            cot = vtk.vtkBandedPolyDataContourFilter()
            cot.ClippingOn()
            # cot.SetInputData(self._vtkPolyDataFilter.GetOutput())
            cot.SetInputData(self._vtkDataSetFittedToViewport)
            cot.SetNumberOfContours(len(l))
            cot.SetClipTolerance(0.)
            for j, v in enumerate(l):
                cot.SetValue(j, v)
            cot.Update()

            cots.append(cot)
            mapper.SetInputConnection(cot.GetOutputPort())
            lut.SetNumberOfTableValues(len(tmpColors[i]))
            for j, color in enumerate(tmpColors[i]):
                r, g, b, a = self.getColorIndexOrRGBA(_colorMap, color)
                if style == 'solid':
                    tmpOpacity = tmpOpacities[j]
                    if tmpOpacity is None:
                        tmpOpacity = a / 100.
                    else:
                        tmpOpacity = tmpOpacities[j] / 100.
                    lut.SetTableValue(j, r / 100., g / 100., b / 100., tmpOpacity)
                else:
                    lut.SetTableValue(j, 1., 1., 1., 0.)
            luts.append([lut, [0, len(l) - 1, True]])
            mapper.SetLookupTable(lut)
            minRange = 0
            maxRange = len(l) - 1
            if (i == 0 and self._scalarRange[0] < l[0]):
                # band 0 is from self._scalarRange[0] to l[0]
                # we don't show band 0
                minRange += 1
            mapper.SetScalarRange(minRange, maxRange)
            mapper.SetScalarModeToUseCellData()
            mappers.append(mapper)

        self._resultDict["vtk_backend_luts"] = luts
        if len(cots) > 0:
            self._resultDict["vtk_backend_contours"] = cots

        numLevels = len(self._contourLevels)
        if mappers == []:  # ok didn't need to have special banded contours
            mapper = vtk.vtkPolyDataMapper()
            mappers = [mapper]
            # Colortable bit
            # make sure length match
            while len(self._contourColors) < len(self._contourLevels):
                self._contourColors.append(self._contourColors[-1])

            lut = vtk.vtkLookupTable()
            lut.SetNumberOfTableValues(numLevels)
            for i in range(numLevels):
                r, g, b, a = self.getColorIndexOrRGBA(_colorMap, self._contourColors[i])
                lut.SetTableValue(i, r / 100., g / 100., b / 100., a / 100.)

            mapper.SetLookupTable(lut)
            if numpy.allclose(self._contourLevels[0], -1.e20):
                lmn = self._min - 1.
            else:
                lmn = self._contourLevels[0]
            if numpy.allclose(self._contourLevels[-1], 1.e20):
                lmx = self._max + 1.
            else:
                lmx = self._contourLevels[-1]
            mapper.SetScalarRange(lmn, lmx)
            self._resultDict["vtk_backend_luts"] = [[lut, [lmn, lmx, True]]]

        if self._maskedDataMapper is not None:
            mappers.insert(0, self._maskedDataMapper)

        # And now we need actors to actually render this thing
        actors = []
        ct = 0
        vp = self._resultDict.get('ratio_autot_viewport',
                                  [self._template.data.x1, self._template.data.x2,
                                   self._template.data.y1, self._template.data.y2])

        # view and interactive area
        view = self._context().contextView
        area = vtk.vtkInteractiveArea()
        view.GetScene().AddItem(area)

        adjusted_plotting_bounds = vcs2vtk.getProjectedBoundsForWorldCoords(
            plotting_dataset_bounds, self._gm.projection)
        drawAreaBounds = vcs2vtk.computeDrawAreaBounds(adjusted_plotting_bounds)

        [renWinWidth, renWinHeight] = self._context().renWin.GetSize()
        geom = vtk.vtkRecti(int(round(vp[0] * renWinWidth)),
                            int(round(vp[2] * renWinHeight)),
                            int(round((vp[1] - vp[0]) * renWinWidth)),
                            int(round((vp[3] - vp[2]) * renWinHeight)))

        vcs2vtk.configureContextArea(area, drawAreaBounds, geom)

        for mapper in mappers:
            act = vtk.vtkActor()
            act.SetMapper(mapper)
            mapper.Update()
            poly = mapper.GetInput()

            if not poly:
                continue

            patact = None
            item = None

            if style == "solid":
                deleteColors = False

                attrs = poly.GetCellData()
                data = attrs.GetScalars()
                if data:
                    lut = mapper.GetLookupTable()
                    scalarRange = mapper.GetScalarRange()
                    lut.SetRange(scalarRange)
                    mappedColors = lut.MapScalars(data, vtk.VTK_COLOR_MODE_DEFAULT, 0)
                    deleteColors = True
                else:
                    print('WARNING: isofill pipeline: poly does not have Scalars array on cell data, using solid color')
                    numTuples = poly.GetNumberOfCells()
                    color = [0, 0, 0, 255]
                    mappedColors = vcs2vtk.generateSolidColorArray(numTuples, color)

                scalarMode = vtk.VTK_SCALAR_MODE_USE_CELL_DATA

                item = vtk.vtkPolyDataItem()
                item.SetPolyData(poly)
                item.SetScalarMode(scalarMode)
                item.SetMappedColors(mappedColors)
                if deleteColors:
                    mappedColors.FastDelete()
                area.GetDrawAreaItem().AddItem(item)

            if mapper is self._maskedDataMapper:
                actors.append([item, self._maskedDataMapper, plotting_dataset_bounds])
            else:
                actors.append([item, plotting_dataset_bounds])

            if mapper is not self._maskedDataMapper:
                # Since pattern creation requires a single color, assuming the first
                c = self.getColorIndexOrRGBA(_colorMap, tmpColors[ct][0])

                patact = fillareautils.make_patterned_polydata(poly,
                                                               fillareastyle=style,
                                                               fillareaindex=tmpIndices[ct],
                                                               fillareacolors=c,
                                                               fillareaopacity=tmpOpacities[ct],
                                                               fillareapixelspacing=fareapixelspacing,
                                                               fillareapixelscale=fareapixelscale,
                                                               size=self._context().renWin.GetSize(),
                                                               screenGeom=[geom[2], geom[3]],
                                                               vpScale=[self._context_xScale, self._context_yScale])

                if patact is not None:
                    patMapper = patact.GetMapper()
                    patMapper.Update()
                    patPoly = patMapper.GetInput()

                    patItem = vtk.vtkPolyDataItem()
                    patItem.SetPolyData(patPoly)

                    patItem.SetScalarMode(vtk.VTK_SCALAR_MODE_USE_CELL_DATA)
                    colorArray = patPoly.GetCellData().GetArray('Colors')

                    patItem.SetMappedColors(colorArray)
                    area.GetDrawAreaItem().AddItem(patItem)

                    actors.append([patItem, plotting_dataset_bounds])

                # increment the count
                ct += 1

        self._resultDict["vtk_backend_actors"] = actors

        z, t = self.getZandT()

        kwargs = {
            "vtk_backend_grid": self._vtkDataSet,
            "dataset_bounds": self._vtkDataSetBounds,
            "plotting_dataset_bounds": plotting_dataset_bounds,
            "vtk_dataset_bounds_no_mask": self._vtkDataSetBoundsNoMask,
            "vtk_backend_geo": self._vtkGeoTransform,
            "vtk_backend_draw_area_bounds": drawAreaBounds,
            "vtk_backend_viewport_scale": [
                self._context_xScale,
                self._context_yScale
            ]
        }
        if ("ratio_autot_viewport" in self._resultDict):
            kwargs["ratio_autot_viewport"] = vp
        self._resultDict.update(self._context().renderTemplate(
            self._template,
            self._data1,
            self._gm, t, z, **kwargs))
        legend = getattr(self._gm, "legend", None)

        if self._gm.ext_1:
            if isinstance(self._contourLevels[0], list):
                if numpy.less(abs(self._contourLevels[0][0]), 1.e20):
                    # Ok we need to add the ext levels
                    self._contourLevels.insert(
                        0, [-1.e20, self._contourLevels[0][0]])
            else:
                if numpy.less(abs(self._contourLevels[0]), 1.e20):
                    # need to add an ext
                    self._contourLevels.insert(0, -1.e20)
        if self._gm.ext_2:
            if isinstance(self._contourLevels[-1], list):
                if numpy.less(abs(self._contourLevels[-1][1]), 1.e20):
                    # need ext
                    self._contourLevels.append([self._contourLevels[-1][1],
                                                1.e20])
            else:
                if numpy.less(abs(self._contourLevels[-1]), 1.e20):
                    # need exts
                    self._contourLevels.append(1.e20)

        # Compensate for the different viewport size of the colorbar
        legendpixspacing = [int(fareapixelspacing[0] / (vp[1] - vp[0])),
                            int(fareapixelspacing[1] / (vp[3] - vp[2]))]
        legendpixscale = fareapixelscale / (vp[1] - vp[0])

        self._resultDict.update(
            self._context().renderColorBar(self._template, self._contourLevels,
                                           self._contourColors, legend,
                                           self.getColorMap(),
                                           style=style,
                                           index=self._gm.fillareaindices,
                                           opacity=self._gm.fillareaopacity,
                                           pixelspacing=legendpixspacing,
                                           pixelscale=legendpixscale))

        projection = vcs.elements["projection"][self._gm.projection]
        kwargs['xaxisconvert'] = self._gm.xaxisconvert
        kwargs['yaxisconvert'] = self._gm.yaxisconvert
        if self._data1.getAxis(-1).isLongitude() and self._data1.getAxis(-2).isLatitude():
            self._context().plotContinents(self._plot_kargs.get("continents", self._useContinents),
                                           plotting_dataset_bounds, projection,
                                           self._dataWrapModulo,
                                           vp, self._template.data.priority, **kwargs)
def DisplaySurface(st):
    """
    Make and display the surface.
    :param: st - the surface to display.
    :return The vtkRenderWindowInteractor.
    """
    surface = st.upper()
    if not (surface in SURFACE_TYPE):
        print(st, "is not a surface.")
        iren = vtk.vtkRenderWindowInteractor()
        return iren
    # ------------------------------------------------------------
    # Create the surface, lookup tables, contour filter etc.
    # ------------------------------------------------------------
    # src = vtk.vtkPolyData()
    # src = Clipper(MakeParametricHills(), 0.5, 0.5, 0.0)
    # src = MakeParametricHills()
    src, linesrc, temps = MakeStrip(1001, 101)

    # Here we are assuming that the active scalars are the curvatures.
    src.GetPointData().SetActiveScalars('Temps')
    scalarRange = src.GetScalarRange()

    lut = MakeLUT()
    # lut.SetNumberOfTableValues(20)
    numberOfBands = lut.GetNumberOfTableValues()
    bands = MakeBands(scalarRange, numberOfBands, False)

    lut.SetTableRange(scalarRange)

    # We will use the midpoint of the band as the label.
    labels = []
    for i in range(numberOfBands):
        labels.append('{:4.2f}'.format(bands[i][1]))

    # Annotate
    values = vtk.vtkVariantArray()
    for i in range(len(labels)):
        values.InsertNextValue(vtk.vtkVariant(labels[i]))
    for i in range(values.GetNumberOfTuples()):
        lut.SetAnnotation(i, values.GetValue(i).ToString())

    # Create the contour bands.
    bcf = vtk.vtkBandedPolyDataContourFilter()
    bcf.SetInputData(src)
    # Use either the minimum or maximum value for each band.
    for i in range(0, numberOfBands):
        bcf.SetValue(i, bands[i][2])
    # We will use an indexed lookup table.
    bcf.SetScalarModeToIndex()
    bcf.GenerateContourEdgesOn()

    # ------------------------------------------------------------
    # Create the mappers and actors
    # ------------------------------------------------------------
    srcMapper = vtk.vtkPolyDataMapper()
    srcMapper.SetInputConnection(bcf.GetOutputPort())
    srcMapper.SetScalarRange(scalarRange)
    srcMapper.SetLookupTable(lut)
    srcMapper.SetScalarModeToUseCellData()

    srcActor = vtk.vtkActor()
    srcActor.SetMapper(srcMapper)

    lineMapper = vtk.vtkPolyDataMapper()
    lineMapper.SetInputData(linesrc)
    lineActor = vtk.vtkActor()
    lineActor.SetMapper(lineMapper)
    lineActor.GetProperty().SetColor(0, 0, 1)

    # Create contour edges
    edgeMapper = vtk.vtkPolyDataMapper()
    edgeMapper.SetInputData(bcf.GetContourEdgesOutput())
    edgeMapper.SetResolveCoincidentTopologyToPolygonOffset()

    edgeActor = vtk.vtkActor()
    edgeActor.SetMapper(edgeMapper)
    edgeActor.GetProperty().SetColor(0, 0, 0)

    # ------------------------------------------------------------
    # Create the RenderWindow, Renderer and Interactor
    # ------------------------------------------------------------
    ren = vtk.vtkRenderer()
    renWin = vtk.vtkRenderWindow()
    iren = vtk.vtkRenderWindowInteractor()

    renWin.AddRenderer(ren)
    iren.SetRenderWindow(renWin)

    # add actors
    ren.AddViewProp(srcActor)
    ren.AddViewProp(edgeActor)
    # ren.AddViewProp(lineActor)

    ren.SetBackground(0.7, 0.8, 1.0)
    renWin.SetSize(800, 800)
    renWin.Render()

    ren.GetActiveCamera().Zoom(1.5)

    return iren
    s.InsertNextValue(v)
polys=vtk.vtkCellArray()
for cell in [[0,1,5,4],[2,3,7,6],[8,9,13,12],[10,11,15,14]]:
    polys.InsertNextCell(4)
    for p in cell:
        polys.InsertCellPoint(p)
ds=vtk.vtkPolyData()
ds.SetPoints(pts)
ds.GetPointData().SetScalars(s)
ds.SetPolys(polys)

src=vtk.vtkTrivialProducer()
src.SetOutput(ds)

# Generate contour bands
bands = vtk.vtkBandedPolyDataContourFilter()
bands.SetScalarModeToIndex()
bands.GenerateContourEdgesOn()
bands.ClippingOff()
bands.SetInputConnection(src.GetOutputPort())

# Now add contour values, some of which are equal to point scalars
clip_values=[0,2,4,6,8,10]
for v in clip_values:
    bands.SetValue(clip_values.index(v), v)
bands.Update()

# Map the indices to clip values
out_indices=bands.GetOutput().GetCellData().GetArray("Scalars")
out_scalars=vtk.vtkDoubleArray()
out_scalars.SetName('values')
def draw_vtk(nodes,
             elements,
             values=None,
             colors_count=256,
             contours_count=10,
             use_gray=False,
             title=None,
             background=(0.95, 0.95, 0.95),
             show_mesh=False,
             mesh_color=(0.25, 0.25, 0.25),
             use_cell_data=False,
             show_labels=False,
             show_axes=False):
    """
    Function draws planar unstructured mesh using vtk
    :param show_axes: if it equals true than axes is drawn
    :param use_cell_data: if it equals true than cell data is used to colorize zones
    :param show_labels: if it equals true than labels are shown
    :param show_mesh: if it equals true than mesh lines are shown
    :param mesh_color: color of mesh lines (polygons edges)
    :param contours_count: Contour lines count
    :param title: Title of the scalar bar
    :param background: Background RGB-color value
    :param use_gray: if it equals true than gray-scale colormap is used
    :param colors_count: Colors count for values visualization
    :param nodes: nodes array [nodes_count; 2]
    :param elements: elements array [elements_count; element_nodes]
    :param values: values array (coloring rule)
    :return: nothing
    """
    import vtk
    points = vtk.vtkPoints()
    for n in nodes:
        if len(n) == 2:
            points.InsertNextPoint([n[0], n[1], 0.0])
        elif len(n) == 3:
            points.InsertNextPoint([n[0], n[1], n[2]])

    cells_array = vtk.vtkCellArray()

    for el in elements:
        polygon = vtk.vtkPolygon()
        polygon.GetPointIds().SetNumberOfIds(len(el))
        for i in range(len(el)):
            polygon.GetPointIds().SetId(i, el[i])

        cells_array.InsertNextCell(polygon)

    lut = vtk.vtkLookupTable()
    lut.SetNumberOfTableValues(colors_count)
    lut.SetHueRange(0.66667, 0.0)

    if use_gray:
        lut.SetValueRange(1.0, 0.0)
        lut.SetSaturationRange(0.0, 0.0)  # no color saturation
        lut.SetRampToLinear()

    lut.Build()
    renderer = vtk.vtkRenderer()
    renderer.SetBackground(background)
    render_window = vtk.vtkRenderWindow()
    render_window.AddRenderer(renderer)
    render_window_interactor = vtk.vtkRenderWindowInteractor()
    render_window_interactor.SetRenderWindow(render_window)

    bcf_actor = vtk.vtkActor()
    bcf_mapper = vtk.vtkPolyDataMapper()
    poly_data = vtk.vtkPolyData()
    poly_data.SetPoints(points)
    poly_data.SetPolys(cells_array)

    if values is not None:
        scalars = vtk.vtkFloatArray()

        for v in values:
            scalars.InsertNextValue(v)

        poly_data.GetPointData().SetScalars(scalars)
        bcf = vtk.vtkBandedPolyDataContourFilter()

        if vtk.VTK_MAJOR_VERSION <= 5:
            bcf.SetInput(poly_data)
        else:
            bcf.SetInputData(poly_data)

        if contours_count > 0:
            bcf.SetNumberOfContours(contours_count)
            bcf.GenerateValues(contours_count, [values.min(), values.max()])
            bcf.SetNumberOfContours(contours_count + 1)
            bcf.GenerateContourEdgesOn()

        bcf.Update()
        bcf_mapper.ImmediateModeRenderingOn()

        if vtk.VTK_MAJOR_VERSION <= 5:
            bcf_mapper.SetInput(bcf.GetOutput())
        else:
            bcf_mapper.SetInputData(bcf.GetOutput())

        bcf_mapper.SetScalarRange(values.min(), values.max())
        bcf_mapper.SetLookupTable(lut)
        bcf_mapper.ScalarVisibilityOn()

        if use_cell_data:
            bcf_mapper.SetScalarModeToUseCellData()

        bcf_actor.SetMapper(bcf_mapper)
        renderer.AddActor(bcf_actor)
        edge_mapper = vtk.vtkPolyDataMapper()

        if vtk.VTK_MAJOR_VERSION <= 5:
            edge_mapper.SetInput(bcf.GetContourEdgesOutput())
        else:
            edge_mapper.SetInputData(bcf.GetContourEdgesOutput())

        edge_mapper.SetResolveCoincidentTopologyToPolygonOffset()
        edge_actor = vtk.vtkActor()
        edge_actor.SetMapper(edge_mapper)

        if use_gray:
            edge_actor.GetProperty().SetColor(0.0, 1.0, 0.0)
        else:
            edge_actor.GetProperty().SetColor(0.0, 0.0, 0.0)

        renderer.AddActor(edge_actor)

        if show_labels:
            mask = vtk.vtkMaskPoints()

            if vtk.VTK_MAJOR_VERSION <= 5:
                mask.SetInput(bcf.GetOutput())
            else:
                mask.SetInputData(bcf.GetOutput())

            mask.SetOnRatio(bcf.GetOutput().GetNumberOfPoints() / 20)
            mask.SetMaximumNumberOfPoints(20)
            # Create labels for points - only show visible points
            visible_points = vtk.vtkSelectVisiblePoints()
            visible_points.SetInputConnection(mask.GetOutputPort())
            visible_points.SetRenderer(renderer)
            ldm = vtk.vtkLabeledDataMapper()
            ldm.SetInputConnection(mask.GetOutputPort())
            ldm.SetLabelFormat("%.2E")
            ldm.SetLabelModeToLabelScalars()
            text_property = ldm.GetLabelTextProperty()
            text_property.SetFontFamilyToArial()
            text_property.SetFontSize(10)

            if use_gray:
                text_property.SetColor(0.0, 1.0, 0.0)
            else:
                text_property.SetColor(0.0, 0.0, 0.0)

            text_property.ShadowOff()
            text_property.BoldOff()
            contour_labels = vtk.vtkActor2D()
            contour_labels.SetMapper(ldm)
            renderer.AddActor(contour_labels)

        scalar_bar = vtk.vtkScalarBarActor()
        scalar_bar.SetOrientationToHorizontal()
        scalar_bar.SetLookupTable(lut)

        if title is not None:
            scalar_bar.SetTitle(title)

        scalar_bar_widget = vtk.vtkScalarBarWidget()
        scalar_bar_widget.SetInteractor(render_window_interactor)
        scalar_bar_widget.SetScalarBarActor(scalar_bar)
        scalar_bar_widget.On()
    else:
        if vtk.VTK_MAJOR_VERSION <= 5:
            bcf_mapper.SetInput(poly_data)
        else:
            bcf_mapper.SetInputData(poly_data)

        bcf_actor.GetProperty().SetColor(0.0, 1.0, 0.0)

    if show_mesh:
        bcf_actor.GetProperty().EdgeVisibilityOn()
        bcf_actor.GetProperty().SetEdgeColor(mesh_color)

    bcf_actor.SetMapper(bcf_mapper)
    renderer.AddActor(bcf_actor)

    if show_axes:
        axes = vtk.vtkAxesActor()
        renderer.AddActor(axes)

    render_window.Render()
    render_window_interactor.Start()
def fxy(z='sin(3*x)*log(x-y)/3', x=[0, 3], y=[0, 3],
zlimits=[None, None], showNan=True, zlevels=10, wire=False,
c='b', bc='aqua', alpha=1, legend=True, texture=None, res=100):
'''
Build a surface representing the 3D function specified as a string
or as a reference to an external function.
Red points indicate where the function does not exist (showNan).
zlevels will draw the specified number of z-levels contour lines.
[**Example**](https://github.com/marcomusy/vtkplotter/blob/master/examples/basic/fxy.py)
'''
if isinstance(z, str):
try:
z = z.replace('math.', '').replace('np.', '')
namespace = locals()
code = "from math import*\ndef zfunc(x,y): return "+z
exec(code, namespace)
z = namespace['zfunc']
except:
vc.printc('Syntax Error in fxy()', c=1)
return None
ps = vtk.vtkPlaneSource()
ps.SetResolution(res, res)
ps.SetNormal([0, 0, 1])
ps.Update()
poly = ps.GetOutput()
dx = x[1]-x[0]
dy = y[1]-y[0]
todel, nans = [], []
if zlevels:
tf = vtk.vtkTriangleFilter()
tf.SetInputData(poly)
tf.Update()
poly = tf.GetOutput()
for i in range(poly.GetNumberOfPoints()):
px, py, _ = poly.GetPoint(i)
xv = (px+.5)*dx+x[0]
yv = (py+.5)*dy+y[0]
try:
zv = z(xv, yv)
poly.GetPoints().SetPoint(i, [xv, yv, zv])
except:
todel.append(i)
nans.append([xv, yv, 0])
if len(todel):
cellIds = vtk.vtkIdList()
poly.BuildLinks()
for i in todel:
poly.GetPointCells(i, cellIds)
for j in range(cellIds.GetNumberOfIds()):
poly.DeleteCell(cellIds.GetId(j)) # flag cell
poly.RemoveDeletedCells()
cl = vtk.vtkCleanPolyData()
cl.SetInputData(poly)
cl.Update()
poly = cl.GetOutput()
if not poly.GetNumberOfPoints():
vc.printc('Function is not real in the domain', c=1)
return None
if zlimits[0]:
tmpact1 = Actor(poly)
a = tmpact1.cutPlane((0, 0, zlimits[0]), (0, 0, 1))
poly = a.polydata()
if zlimits[1]:
tmpact2 = Actor(poly)
a = tmpact2.cutPlane((0, 0, zlimits[1]), (0, 0, -1))
poly = a.polydata()
if c is None:
elev = vtk.vtkElevationFilter()
elev.SetInputData(poly)
elev.Update()
poly = elev.GetOutput()
actor = Actor(poly, c=c, bc=bc, alpha=alpha, wire=wire,
legend=legend, texture=texture)
acts = [actor]
if zlevels:
elevation = vtk.vtkElevationFilter()
elevation.SetInputData(poly)
bounds = poly.GetBounds()
elevation.SetLowPoint( 0, 0, bounds[4])
elevation.SetHighPoint(0, 0, bounds[5])
elevation.Update()
bcf = vtk.vtkBandedPolyDataContourFilter()
bcf.SetInputData(elevation.GetOutput())
bcf.SetScalarModeToValue()
bcf.GenerateContourEdgesOn()
bcf.GenerateValues(zlevels, elevation.GetScalarRange())
bcf.Update()
zpoly = bcf.GetContourEdgesOutput()
zbandsact = Actor(zpoly, c='k', alpha=alpha)
zbandsact.GetProperty().SetLineWidth(1.5)
acts.append(zbandsact)
if showNan and len(todel):
bb = actor.GetBounds()
zm = (bb[4]+bb[5])/2
nans = np.array(nans)+[0, 0, zm]
nansact = vs.points(nans, c='red', alpha=alpha/2)
acts.append(nansact)
if len(acts) > 1:
asse = Assembly(acts)
return asse
else:
return actor
def DisplaySurface(st):
    '''
    Make and display the surface.
    :param: st - the surface to display.
    :return The vtkRenderWindowInteractor.
    '''
    surface = st.upper()
    if (not (surface in SURFACE_TYPE)):
        print st, "is not a surface."
        iren = vtk.vtkRenderWindowInteractor()
        return iren
    # ------------------------------------------------------------
    # Create the surface, lookup tables, contour filter etc.
    # ------------------------------------------------------------
    src = vtk.vtkPolyData()
    if (surface == "PLANE"):
        src = MakePlane()
    elif (surface == "SPHERE"):
        src = MakeSphere()
    elif (surface == "PARAMETRIC_SURFACE"):
        src = MakeParametricSource()
        # The scalars are named "Scalars"by default
        # in the parametric surfaces, so change the name.
        src.GetPointData().GetScalars().SetName("Elevation")
    scalarRange = src.GetScalarRange()

    lut = MakeLUT()
    lut.SetTableRange(scalarRange)
    numberOfBands = lut.GetNumberOfTableValues()
    # bands = MakeIntegralBands(scalarRange)
    bands = MakeBands(scalarRange, numberOfBands, False)

    # Let's do a frequency table.
    # The number of scalars in each band.
    #print Frequencies(bands, src)

    # We will use the midpoint of the band as the label.
    labels = []
    for i in range(len(bands)):
        labels.append('{:4.2f}'.format(bands[i][1]))

    # Annotate
    values = vtk.vtkVariantArray()
    for i in range(len(labels)):
        values.InsertNextValue(vtk.vtkVariant(labels[i]))
    for i in range(values.GetNumberOfTuples()):
        lut.SetAnnotation(i,
                          values.GetValue(i).ToString())

    # Create a lookup table with the colors reversed.
    lutr = ReverseLUT(lut)

    # Create the contour bands.
    bcf = vtk.vtkBandedPolyDataContourFilter()
    bcf.SetInputData(src)
    # Use either the minimum or maximum value for each band.
    for i in range(0, numberOfBands):
        bcf.SetValue(i, bands[i][2])
    # We will use an indexed lookup table.
    bcf.SetScalarModeToIndex()
    bcf.GenerateContourEdgesOn()

    # Generate the glyphs on the original surface.
    glyph = MakeGlyphs(src, False)

    # ------------------------------------------------------------
    # Create the mappers and actors
    # ------------------------------------------------------------
    srcMapper = vtk.vtkPolyDataMapper()
    srcMapper.SetInputConnection(bcf.GetOutputPort())
    srcMapper.SetScalarRange(scalarRange)
    srcMapper.SetLookupTable(lut)
    srcMapper.SetScalarModeToUseCellData()

    srcActor = vtk.vtkActor()
    srcActor.SetMapper(srcMapper)
    srcActor.RotateX(-45)
    srcActor.RotateZ(45)

    # Create contour edges
    edgeMapper = vtk.vtkPolyDataMapper()
    edgeMapper.SetInputData(bcf.GetContourEdgesOutput())
    edgeMapper.SetResolveCoincidentTopologyToPolygonOffset()

    edgeActor = vtk.vtkActor()
    edgeActor.SetMapper(edgeMapper)
    edgeActor.GetProperty().SetColor(0, 0, 0)
    edgeActor.RotateX(-45)
    edgeActor.RotateZ(45)

    glyphMapper = vtk.vtkPolyDataMapper()
    glyphMapper.SetInputConnection(glyph.GetOutputPort())
    glyphMapper.SetScalarModeToUsePointFieldData()
    glyphMapper.SetColorModeToMapScalars()
    glyphMapper.ScalarVisibilityOn()
    glyphMapper.SelectColorArray('Elevation')
    # Colour by scalars.
    glyphMapper.SetScalarRange(scalarRange)

    glyphActor = vtk.vtkActor()
    glyphActor.SetMapper(glyphMapper)
    glyphActor.RotateX(-45)
    glyphActor.RotateZ(45)

    # Add a scalar bar.
    scalarBar = vtk.vtkScalarBarActor()
    # scalarBar.SetLookupTable(lut)
    # Use this LUT if you want the highest value at the top.
    scalarBar.SetLookupTable(lutr)
    scalarBar.SetTitle('Elevation (m)')

    # ------------------------------------------------------------
    # Create the RenderWindow, Renderer and Interactor
    # ------------------------------------------------------------
    ren = vtk.vtkRenderer()
    renWin = vtk.vtkRenderWindow()
    iren = vtk.vtkRenderWindowInteractor()

    renWin.AddRenderer(ren)
    iren.SetRenderWindow(renWin)

    # add actors
    ren.AddViewProp(srcActor)
    ren.AddViewProp(edgeActor)
    ren.AddViewProp(glyphActor)
    ren.AddActor2D(scalarBar)

    ren.SetBackground(0.7, 0.8, 1.0)
    renWin.SetSize(800, 800)
    renWin.Render()

    ren.GetActiveCamera().Zoom(1.5)

    return iren
def fxy(
        z="sin(3*x)*log(x-y)/3",
        x=(0, 3),
        y=(0, 3),
        zlimits=(None, None),
        showNan=True,
        zlevels=10,
        c="b",
        bc="aqua",
        alpha=1,
        texture="paper",
        res=(100, 100),
):
    """
    Build a surface representing the function :math:`f(x,y)` specified as a string
    or as a reference to an external function.

    :param float x: x range of values.
    :param float y: y range of values.
    :param float zlimits: limit the z range of the independent variable.
    :param int zlevels: will draw the specified number of z-levels contour lines.
    :param bool showNan: show where the function does not exist as red points.
    :param list res: resolution in x and y.

    |fxy| |fxy.py|_

        Function is: :math:`f(x,y)=\sin(3x) \cdot \log(x-y)/3` in range :math:`x=[0,3], y=[0,3]`.
    """
    if isinstance(z, str):
        try:
            z = z.replace("math.", "").replace("np.", "")
            namespace = locals()
            code = "from math import*\ndef zfunc(x,y): return " + z
            exec(code, namespace)
            z = namespace["zfunc"]
        except:
            colors.printc("Syntax Error in fxy()", c=1)
            return None

    ps = vtk.vtkPlaneSource()
    ps.SetResolution(res[0], res[1])
    ps.SetNormal([0, 0, 1])
    ps.Update()
    poly = ps.GetOutput()
    dx = x[1] - x[0]
    dy = y[1] - y[0]
    todel, nans = [], []

    for i in range(poly.GetNumberOfPoints()):
        px, py, _ = poly.GetPoint(i)
        xv = (px + 0.5) * dx + x[0]
        yv = (py + 0.5) * dy + y[0]
        try:
            zv = z(xv, yv)
        except:
            zv = 0
            todel.append(i)
            nans.append([xv, yv, 0])
        poly.GetPoints().SetPoint(i, [xv, yv, zv])

    if len(todel):
        cellIds = vtk.vtkIdList()
        poly.BuildLinks()
        for i in todel:
            poly.GetPointCells(i, cellIds)
            for j in range(cellIds.GetNumberOfIds()):
                poly.DeleteCell(cellIds.GetId(j))  # flag cell
        poly.RemoveDeletedCells()
        cl = vtk.vtkCleanPolyData()
        cl.SetInputData(poly)
        cl.Update()
        poly = cl.GetOutput()

    if not poly.GetNumberOfPoints():
        colors.printc("Function is not real in the domain", c=1)
        return None

    if zlimits[0]:
        tmpact1 = Actor(poly)
        a = tmpact1.cutWithPlane((0, 0, zlimits[0]), (0, 0, 1))
        poly = a.polydata()
    if zlimits[1]:
        tmpact2 = Actor(poly)
        a = tmpact2.cutWithPlane((0, 0, zlimits[1]), (0, 0, -1))
        poly = a.polydata()

    if c is None:
        elev = vtk.vtkElevationFilter()
        elev.SetInputData(poly)
        elev.Update()
        poly = elev.GetOutput()

    actor = Actor(poly, c, alpha).computeNormals().lighting("plastic")
    if c is None:
        actor.scalars("Elevation")

    if bc:
        actor.bc(bc)

    actor.texture(texture)

    acts = [actor]
    if zlevels:
        elevation = vtk.vtkElevationFilter()
        elevation.SetInputData(poly)
        bounds = poly.GetBounds()
        elevation.SetLowPoint(0, 0, bounds[4])
        elevation.SetHighPoint(0, 0, bounds[5])
        elevation.Update()
        bcf = vtk.vtkBandedPolyDataContourFilter()
        bcf.SetInputData(elevation.GetOutput())
        bcf.SetScalarModeToValue()
        bcf.GenerateContourEdgesOn()
        bcf.GenerateValues(zlevels, elevation.GetScalarRange())
        bcf.Update()
        zpoly = bcf.GetContourEdgesOutput()
        zbandsact = Actor(zpoly, "k", alpha).lw(0.5)
        acts.append(zbandsact)

    if showNan and len(todel):
        bb = actor.GetBounds()
        if bb[4] <= 0 and bb[5] >= 0:
            zm = 0.0
        else:
            zm = (bb[4] + bb[5]) / 2
        nans = np.array(nans) + [0, 0, zm]
        nansact = shapes.Points(nans, r=2, c="red", alpha=alpha)
        nansact.GetProperty().RenderPointsAsSpheresOff()
        acts.append(nansact)

    if len(acts) > 1:
        return Assembly(acts)
    else:
        return actor
    def test(self):
        '''
          Create a cone, contour it using the banded contour filter and
              color it with the primary additive and subtractive colors.
        '''
        namedColors = vtk.vtkNamedColors()
        # Test printing of the object
        # Uncomment if desired
        #print namedColors

        # How to get a list of colors
        colors = namedColors.GetColorNames()
        colors = colors.split('\n')
        # Uncomment if desired
        #print 'Number of colors:', len(colors)
        #print colors

        # How to get a list of a list of synonyms.
        syn = namedColors.GetSynonyms()
        syn = syn.split('\n\n')
        synonyms = []
        for ele in syn:
            synonyms.append(ele.split('\n'))
        # Uncomment if desired
        #print 'Number of synonyms:', len(synonyms)
        #print synonyms

        # Create a cone
        coneSource = vtk.vtkConeSource()
        coneSource.SetCenter(0.0, 0.0, 0.0)
        coneSource.SetRadius(5.0)
        coneSource.SetHeight(10)
        coneSource.SetDirection(0, 1, 0)
        coneSource.Update()

        bounds = [1.0, -1.0, 1.0, -1.0, 1.0, -1.0]
        coneSource.GetOutput().GetBounds(bounds)

        elevation = vtk.vtkElevationFilter()
        elevation.SetInputConnection(coneSource.GetOutputPort())
        elevation.SetLowPoint(0, bounds[2], 0)
        elevation.SetHighPoint(0, bounds[3], 0)

        bcf = vtk.vtkBandedPolyDataContourFilter()
        bcf.SetInputConnection(elevation.GetOutputPort())
        bcf.SetScalarModeToValue()
        bcf.GenerateContourEdgesOn()
        bcf.GenerateValues(7, elevation.GetScalarRange())

        # Build a simple lookup table of
        # primary additive and subtractive colors.
        lut = vtk.vtkLookupTable()
        lut.SetNumberOfTableValues(7)
        rgba = [0.0, 0.0, 0.0, 1.0]
        # Test setting and getting a color here.
        namedColors.GetColor("Red", rgba)
        namedColors.SetColor("My Red", rgba)
        namedColors.GetColor("My Red", rgba)
        lut.SetTableValue(0, rgba)
        namedColors.GetColor("DarkGreen", rgba)
        lut.SetTableValue(1, rgba)
        namedColors.GetColor("Blue", rgba)
        lut.SetTableValue(2, rgba)
        namedColors.GetColor("Cyan", rgba)
        lut.SetTableValue(3, rgba)
        namedColors.GetColor("Magenta", rgba)
        lut.SetTableValue(4, rgba)
        namedColors.GetColor("Yellow", rgba)
        lut.SetTableValue(5, rgba)
        namedColors.GetColor("White", rgba)
        lut.SetTableValue(6, rgba)
        lut.SetTableRange(elevation.GetScalarRange())
        lut.Build()

        mapper = vtk.vtkPolyDataMapper()
        mapper.SetInputConnection(bcf.GetOutputPort())
        mapper.SetLookupTable(lut)
        mapper.SetScalarModeToUseCellData()

        contourLineMapper = vtk.vtkPolyDataMapper()
        contourLineMapper.SetInputData(bcf.GetContourEdgesOutput())
        contourLineMapper.SetScalarRange(elevation.GetScalarRange())
        contourLineMapper.SetResolveCoincidentTopologyToPolygonOffset()

        actor = vtk.vtkActor()
        actor.SetMapper(mapper)

        contourLineActor = vtk.vtkActor()
        contourLineActor.SetMapper(contourLineMapper)
        rgb = [0.0, 0.0, 0.0]
        namedColors.GetColorRGB("black", rgb)
        contourLineActor.GetProperty().SetColor(rgb)

        renderer = vtk.vtkRenderer()
        renderWindow = vtk.vtkRenderWindow()
        renderWindow.AddRenderer(renderer)
        iRen = vtk.vtkRenderWindowInteractor()
        iRen.SetRenderWindow(renderWindow)

        renderer.AddActor(actor)
        renderer.AddActor(contourLineActor)
        namedColors.GetColorRGB("SteelBlue", rgb)
        renderer.SetBackground(rgb)

        renderWindow.Render()
        img_file = "TestNamedColorsIntegration.png"
        vtk.test.Testing.compareImage(
            iRen.GetRenderWindow(),
            vtk.test.Testing.getAbsImagePath(img_file),
            threshold=25)
        vtk.test.Testing.interact()
shrink.SetInputConnection(demModel.GetOutputPort())
shrink.AveragingOn()

# Convert the image into polygons.
geom = vtk.vtkImageDataGeometryFilter()
geom.SetInputConnection(shrink.GetOutputPort())

# Warp the polygons based on elevation.
warp = vtk.vtkWarpScalar()
warp.SetInputConnection(geom.GetOutputPort())
warp.SetNormal(0, 0, 1)
warp.UseNormalOn()
warp.SetScaleFactor(Scale)

# Create the contour bands.
bcf = vtk.vtkBandedPolyDataContourFilter()
bcf.SetInputConnection(warp.GetOutputPort())
bcf.GenerateValues(15, demModel.GetOutput().GetScalarRange())
bcf.SetScalarModeToIndex()
bcf.GenerateContourEdgesOn()

# Compute normals to give a better look.
normals = vtk.vtkPolyDataNormals()
normals.SetInputConnection(bcf.GetOutputPort())
normals.SetFeatureAngle(60)
normals.ConsistencyOff()
normals.SplittingOff()

demMapper = vtk.vtkPolyDataMapper()
demMapper.SetInputConnection(normals.GetOutputPort())
demMapper.SetScalarRange(0, 10)