def procrustes(sources, rigid=False, legend=None):
    '''
    Return an Assembly of aligned source actors with
    the vtkProcrustesAlignmentFilter class. Assembly is normalized in space.

    Takes N set of points and aligns them in a least-squares sense
    to their mutual mean. The algorithm is iterated until convergence,
    as the mean must be recomputed after each alignment.
    '''
    group = vtk.vtkMultiBlockDataGroupFilter()
    for source in sources:
        if sources[0].N() != source.N():
            vc.printc('Procrustes error in align():' , c=1)
            vc.printc(' sources have different nr of points', c=1)
            exit(0)
        group.AddInputData(source.polydata())
    procrustes = vtk.vtkProcrustesAlignmentFilter()
    procrustes.StartFromCentroidOn()
    procrustes.SetInputConnection(group.GetOutputPort())
    if rigid:
        procrustes.GetLandmarkTransform().SetModeToRigidBody()
    procrustes.Update()

    acts = []
    for i in range(len(sources)):
        poly = procrustes.GetOutput().GetBlock(i)
        actor = Actor(poly)
        actor.SetProperty(sources[i].GetProperty())
        acts.append(actor)
    assem = Assembly(acts, legend=legend)
    assem.info['transform'] = procrustes.GetLandmarkTransform()
    return assem
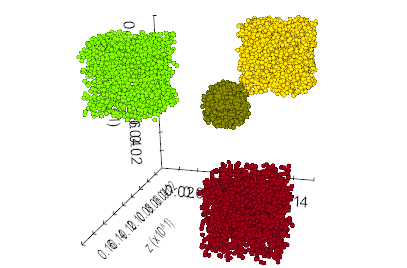
def cluster(points, radius, legend=None):
'''
Clustering of points in space.
radius, is the radius of local search.
Individual subsets can be accessed through actor.clusters
[**Example**](https://github.com/marcomusy/vtkplotter/blob/master/examples/basic/clustering.py)
'''
if isinstance(points, vtk.vtkActor):
poly = points.polydata()
else:
src = vtk.vtkPointSource()
src.SetNumberOfPoints(len(points))
src.Update()
vpts = src.GetOutput().GetPoints()
for i, p in enumerate(points):
vpts.SetPoint(i, p)
poly = src.GetOutput()
cluster = vtk.vtkEuclideanClusterExtraction()
cluster.SetInputData(poly)
cluster.SetExtractionModeToAllClusters()
cluster.SetRadius(radius)
cluster.ColorClustersOn()
cluster.Update()
idsarr = cluster.GetOutput().GetPointData().GetArray('ClusterId')
Nc = cluster.GetNumberOfExtractedClusters()
sets = [[] for i in range(Nc)]
for i, p in enumerate(points):
sets[idsarr.GetValue(i)].append(p)
acts = []
for i, aset in enumerate(sets):
acts.append(vs.points(aset, c=i))
actor = Assembly(acts, legend=legend)
actor.info['clusters'] = sets
print('Nr. of extracted clusters', Nc)
if Nc > 10:
print('First ten:')
for i in range(Nc):
if i > 9:
print('...')
break
print('Cluster #'+str(i)+', N =', len(sets[i]))
print('Access individual clusters through attribute: actor.cluster')
return actor
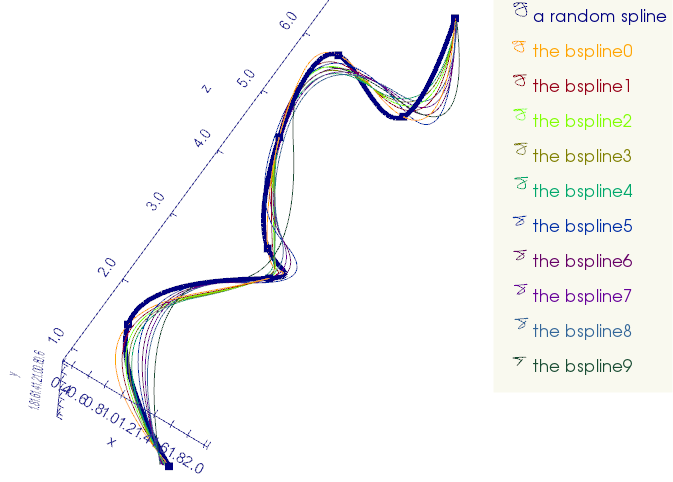
def spline(points, smooth=0.5, degree=2,
s=2, c='b', alpha=1., nodes=False, legend=None, res=20):
'''
Return a vtkActor for a spline that doesnt necessarly pass exactly throught all points.
Options:
smooth, smoothing factor:
0 = interpolate points exactly,
1 = average point positions
degree = degree of the spline (1<degree<5)
nodes = True shows also original the points
[**Example**](https://github.com/marcomusy/vtkplotter/blob/master/examples/tutorial.py)
'''
try:
from scipy.interpolate import splprep, splev
except ImportError:
vc.printc('Warning: ..scipy not installed, using vtkCardinalSpline instead.', c=5)
return _vtkspline(points, s, c, alpha, nodes, legend, res)
Nout = len(points)*res # Number of points on the spline
points = np.array(points)
minx, miny, minz = np.min(points, axis=0)
maxx, maxy, maxz = np.max(points, axis=0)
maxb = max(maxx-minx, maxy-miny, maxz-minz)
smooth *= maxb/2 # must be in absolute units
x, y, z = points[:, 0], points[:, 1], points[:, 2]
tckp, _ = splprep([x, y, z], task=0, s=smooth, k=degree) # find the knots
# evaluate spline, including interpolated points:
xnew, ynew, znew = splev(np.linspace(0, 1, Nout), tckp)
ppoints = vtk.vtkPoints() # Generate the polyline for the spline
profileData = vtk.vtkPolyData()
ppoints.SetData(numpy_to_vtk( list(zip(xnew, ynew, znew)), deep=True))
lines = vtk.vtkCellArray() # Create the polyline
lines.InsertNextCell(Nout)
for i in range(Nout):
lines.InsertCellPoint(i)
profileData.SetPoints(ppoints)
profileData.SetLines(lines)
actline = Actor(profileData, c=c, alpha=alpha, legend=legend)
actline.GetProperty().SetLineWidth(s)
if nodes:
actnodes = vs.points(points, r=5, c=c, alpha=alpha)
ass = Assembly([actline, actnodes], legend=legend)
return ass
else:
return actline
def Earth(pos=(0, 0, 0), r=1, lw=1):
    """Build a textured actor representing the Earth.

    .. hint:: |geodesic| |geodesic.py|_
    """
    import os

    tss = vtk.vtkTexturedSphereSource()
    tss.SetRadius(r)
    tss.SetThetaResolution(72)
    tss.SetPhiResolution(36)
    earthMapper = vtk.vtkPolyDataMapper()
    earthMapper.SetInputConnection(tss.GetOutputPort())
    earthActor = Actor(c="w")
    earthActor.SetMapper(earthMapper)
    atext = vtk.vtkTexture()
    pnmReader = vtk.vtkPNMReader()
    cdir = os.path.dirname(__file__)
    if cdir == "":
        cdir = "."
    fn = settings.textures_path + "earth.ppm"
    pnmReader.SetFileName(fn)
    atext.SetInputConnection(pnmReader.GetOutputPort())
    atext.InterpolateOn()
    earthActor.SetTexture(atext)
    if not lw:
        earthActor.SetPosition(pos)
        return earthActor
    es = vtk.vtkEarthSource()
    es.SetRadius(r / 0.995)
    earth2Mapper = vtk.vtkPolyDataMapper()
    earth2Mapper.SetInputConnection(es.GetOutputPort())
    earth2Actor = Actor()  # vtk.vtkActor()
    earth2Actor.SetMapper(earth2Mapper)
    earth2Mapper.ScalarVisibilityOff()
    earth2Actor.GetProperty().SetLineWidth(lw)
    ass = Assembly([earthActor, earth2Actor])
    ass.SetPosition(pos)
    settings.collectable_actors.append(ass)
    return ass
def earth(pos=[0, 0, 0], r=1, lw=1):
    '''Build a textured actor representing the Earth.

    .. hint:: Example: `earth.py <https://github.com/marcomusy/vtkplotter/blob/master/examples/basic/earth.py>`_

        .. image:: https://user-images.githubusercontent.com/32848391/51031592-5a448700-159d-11e9-9b66-bee6abb18679.png
    '''
    import os
    tss = vtk.vtkTexturedSphereSource()
    tss.SetRadius(r)
    tss.SetThetaResolution(72)
    tss.SetPhiResolution(36)
    earthMapper = vtk.vtkPolyDataMapper()
    earthMapper.SetInputConnection(tss.GetOutputPort())
    earthActor = Actor()  #vtk.vtkActor()
    earthActor.SetMapper(earthMapper)
    atext = vtk.vtkTexture()
    pnmReader = vtk.vtkPNMReader()
    cdir = os.path.dirname(__file__)
    if cdir == '':
        cdir = '.'
    fn = cdir + '/textures/earth.ppm'
    pnmReader.SetFileName(fn)
    atext.SetInputConnection(pnmReader.GetOutputPort())
    atext.InterpolateOn()
    earthActor.SetTexture(atext)
    if not lw:
        earthActor.SetPosition(pos)
        return earthActor
    es = vtk.vtkEarthSource()
    es.SetRadius(r / .995)
    earth2Mapper = vtk.vtkPolyDataMapper()
    earth2Mapper.SetInputConnection(es.GetOutputPort())
    earth2Actor = Actor()  # vtk.vtkActor()
    earth2Actor.SetMapper(earth2Mapper)
    earth2Actor.GetProperty().SetLineWidth(lw)
    ass = Assembly([earthActor, earth2Actor])
    ass.SetPosition(pos)
    return ass
def trimesh2vtk(inputobj, alphaPerCell=False):
    """Convert trimesh object to ``Actor(vtkActor)`` object."""
    from vtkplotter import Actor

    #colors.printc('trimesh2vtk inputobj', type(inputobj), c=3)

    inputobj_type = str(type(inputobj))

    if "Trimesh" in inputobj_type or "primitives" in inputobj_type:
        faces = inputobj.faces
        poly = buildPolyData(inputobj.vertices, faces)
        tact = Actor(poly)
        if inputobj.visual.kind == 'face':
            trim_c = inputobj.visual.face_colors
        else:
            trim_c = inputobj.visual.vertex_colors

        if isSequence(trim_c):
            if isSequence(trim_c[0]):
                trim_cc = trim_c[:, [0, 1, 2]] / 255
                trim_al = trim_c[:, 3] / 255
                if inputobj.visual.kind == 'face':
                    tact.colorCellsByArray(trim_cc, trim_al, alphaPerCell)
                else:
                    tact.colorVerticesByArray(trim_cc, trim_al)
        else:
            print('trim_c not sequence?', trim_c)
        return tact

    elif "PointCloud" in inputobj_type:
        from vtkplotter.shapes import Points
        trim_cc, trim_al = 'black', 1
        if hasattr(inputobj, 'vertices_color'):
            trim_c = inputobj.vertices_color
            if len(trim_c):
                trim_cc = trim_c[:, [0, 1, 2]] / 255
                trim_al = trim_c[:, 3] / 255
                trim_al = np.sum(trim_al) / len(trim_al)  # just the average
        return Points(inputobj.vertices, r=8, c=trim_cc, alpha=trim_al)

    elif "path" in inputobj_type:
        from vtkplotter.shapes import Line
        from vtkplotter.actors import Assembly
        lines = []
        for e in inputobj.entities:
            #print('trimesh entity', e.to_dict())
            l = Line(inputobj.vertices[e.points], c='k', lw=2)
            lines.append(l)
        return Assembly(lines)

    return None
    def showInset(self, *actors,
                  **options):  #pos=3, size=0.1, c='r', draggable=True):
        """Add a draggable inset space into a renderer.

        :param pos: icon position in the range [1-4] indicating one of the 4 corners,
                    or it can be a tuple (x,y) as a fraction of the renderer size.
        :param float size: size of the square inset.
        :param bool draggable: if True the subrenderer space can be dragged around.

        .. hint:: |inset| |inset.py|_
        """
        pos = options.pop("pos", None)
        size = options.pop("size", 0.1)
        c = options.pop("c", 'r')
        draggable = options.pop("draggable", True)

        if not self.renderer:
            colors.printc(
                "~lightningWarning: Use showInset() after first rendering the scene.",
                c=3)
            save_int = self.interactive
            self.show(interactive=0)
            self.interactive = save_int
        widget = vtk.vtkOrientationMarkerWidget()
        r, g, b = colors.getColor(c)
        widget.SetOutlineColor(r, g, b)
        if len(actors) == 1:
            widget.SetOrientationMarker(actors[0])
        else:
            widget.SetOrientationMarker(Assembly(utils.flatten(actors)))
        widget.SetInteractor(self.interactor)
        if utils.isSequence(pos):
            widget.SetViewport(pos[0] - size, pos[1] - size, pos[0] + size,
                               pos[1] + size)
        else:
            if pos < 2:
                widget.SetViewport(0, 1 - 2 * size, size * 2, 1)
            elif pos == 2:
                widget.SetViewport(1 - 2 * size, 1 - 2 * size, 1, 1)
            elif pos == 3:
                widget.SetViewport(0, 0, size * 2, size * 2)
            elif pos == 4:
                widget.SetViewport(1 - 2 * size, 0, 1, size * 2)
        widget.EnabledOn()
        widget.SetInteractive(draggable)
        self.widgets.append(widget)
        for a in actors:
            if a in self.actors:
                self.actors.remove(a)
        return widget
def earth(pos=[0, 0, 0], r=1, lw=1):
    '''Build a textured actor representing the Earth.

    [**Example**](https://github.com/marcomusy/vtkplotter/blob/master/examples/basic/earth.py)
    '''
    import os
    tss = vtk.vtkTexturedSphereSource()
    tss.SetRadius(r)
    tss.SetThetaResolution(72)
    tss.SetPhiResolution(36)
    earthMapper = vtk.vtkPolyDataMapper()
    earthMapper.SetInputConnection(tss.GetOutputPort())
    earthActor = Actor()  #vtk.vtkActor()
    earthActor.SetMapper(earthMapper)
    atext = vtk.vtkTexture()
    pnmReader = vtk.vtkPNMReader()
    cdir = os.path.dirname(__file__)
    if cdir == '':
        cdir = '.'
    fn = cdir + '/textures/earth.ppm'
    pnmReader.SetFileName(fn)
    atext.SetInputConnection(pnmReader.GetOutputPort())
    atext.InterpolateOn()
    earthActor.SetTexture(atext)
    if not lw:
        earthActor.SetPosition(pos)
        return earthActor
    es = vtk.vtkEarthSource()
    es.SetRadius(r / .995)
    earth2Mapper = vtk.vtkPolyDataMapper()
    earth2Mapper.SetInputConnection(es.GetOutputPort())
    earth2Actor = Actor()  # vtk.vtkActor()
    earth2Actor.SetMapper(earth2Mapper)
    earth2Actor.GetProperty().SetLineWidth(lw)
    ass = Assembly([earthActor, earth2Actor])
    ass.SetPosition(pos)
    return ass
def load3DS(filename, legend=None):
    renderer = vtk.vtkRenderer()
    renWin = vtk.vtkRenderWindow()
    renWin.AddRenderer(renderer)

    importer = vtk.vtk3DSImporter()
    importer.SetFileName(filename)
    importer.ComputeNormalsOn()
    importer.SetRenderWindow(renWin)
    importer.Update()

    actors = renderer.GetActors()  # vtkActorCollection
    acts = []
    for i in range(actors.GetNumberOfItems()):
        a = actors.GetItemAsObject(i)
        acts.append(a)
    del renWin
    return Assembly(acts, legend=legend)
def normals(actor, ratio=5, c=(0.6, 0.6, 0.6), alpha=0.8, legend=None):
    '''
    Build a vtkActor made of the normals at vertices shown as arrows

    [**Example1**](https://github.com/marcomusy/vtkplotter/blob/master/examples/tutorial.py)
    [**Example2**](https://github.com/marcomusy/vtkplotter/blob/master/examples/advanced/fatlimb.py)
    '''
    maskPts = vtk.vtkMaskPoints()
    maskPts.SetOnRatio(ratio)
    maskPts.RandomModeOff()
    src = actor.polydata()
    maskPts.SetInputData(src)
    arrow = vtk.vtkLineSource()
    arrow.SetPoint1(0,0,0)
    arrow.SetPoint2(.75,0,0)
    glyph = vtk.vtkGlyph3D()
    glyph.SetSourceConnection(arrow.GetOutputPort())
    glyph.SetInputConnection(maskPts.GetOutputPort())
    glyph.SetVectorModeToUseNormal()
    b = src.GetBounds()
    sc = max([b[1]-b[0], b[3]-b[2], b[5]-b[4]])/20.
    glyph.SetScaleFactor(sc)
    glyph.SetColorModeToColorByVector()
    glyph.SetScaleModeToScaleByVector()
    glyph.OrientOn()
    glyph.Update()
    glyphMapper = vtk.vtkPolyDataMapper()
    glyphMapper.SetInputConnection(glyph.GetOutputPort())
    glyphMapper.SetScalarModeToUsePointFieldData()
    glyphMapper.SetColorModeToMapScalars()
    glyphMapper.ScalarVisibilityOn()
    glyphMapper.SelectColorArray("Elevation")
    glyphActor = vtk.vtkActor()
    glyphActor.SetMapper(glyphMapper)
    glyphActor.GetProperty().EdgeVisibilityOff()
    glyphActor.GetProperty().SetColor(vc.getColor(c))
    # check if color string contains a float, in this case ignore alpha
    al = vc.getAlpha(c)
    if al:
        alpha = al
    glyphActor.GetProperty().SetOpacity(alpha)
    glyphActor.PickableOff()
    aactor = Assembly([actor, glyphActor], legend=legend)
    return aactor
def load3DS(filename):
    """Load ``3DS`` file format from file. Return an ``Assembly(vtkAssembly)`` object."""
    renderer = vtk.vtkRenderer()
    renWin = vtk.vtkRenderWindow()
    renWin.AddRenderer(renderer)

    importer = vtk.vtk3DSImporter()
    importer.SetFileName(filename)
    importer.ComputeNormalsOn()
    importer.SetRenderWindow(renWin)
    importer.Update()

    actors = renderer.GetActors()  # vtkActorCollection
    acts = []
    for i in range(actors.GetNumberOfItems()):
        a = actors.GetItemAsObject(i)
        acts.append(a)
    del renWin
    return Assembly(acts)
def _load_file(filename, c, alpha, threshold, spacing, unpack):
    fl = filename.lower()

    ################################################################# other formats:
    if fl.endswith(".xml") or fl.endswith(".xml.gz") or fl.endswith(".xdmf"):
        # Fenics tetrahedral file
        actor = loadDolfin(filename)
    elif fl.endswith(".neutral") or fl.endswith(".neu"):  # neutral tetrahedral file
        actor = loadNeutral(filename)
    elif fl.endswith(".gmsh"):  # gmesh file
        actor = loadGmesh(filename)
    elif fl.endswith(".pcd"):  # PCL point-cloud format
        actor = loadPCD(filename)
        actor.GetProperty().SetPointSize(2)
    elif fl.endswith(".off"):
        actor = loadOFF(filename)
    elif fl.endswith(".3ds"):  # 3ds format
        actor = load3DS(filename)
    elif fl.endswith(".wrl"):
        importer = vtk.vtkVRMLImporter()
        importer.SetFileName(filename)
        importer.Read()
        importer.Update()
        actors = importer.GetRenderer().GetActors() #vtkActorCollection
        actors.InitTraversal()
        wacts = []
        for i in range(actors.GetNumberOfItems()):
            act = actors.GetNextActor()
            wacts.append(act)
        actor = Assembly(wacts)

        ################################################################# volumetric:
    elif fl.endswith(".tif") or fl.endswith(".slc") or fl.endswith(".vti") \
        or fl.endswith(".mhd") or fl.endswith(".nrrd") or fl.endswith(".nii") \
        or fl.endswith(".dem"):
        img = loadImageData(filename, spacing)
        if threshold is False:
            if c is None and alpha == 1:
                c = ['b','lb','lg','y','r'] # good for blackboard background
                alpha = (0.0, 0.0, 0.2, 0.4, 0.8, 1)
            actor = Volume(img, c, alpha)
        else:
            actor = Volume(img).isosurface(threshold=threshold)
            actor.color(c).alpha(alpha)

        ################################################################# 2D images:
    elif fl.endswith(".png") or fl.endswith(".jpg") or fl.endswith(".bmp") or fl.endswith(".jpeg"):
        if ".png" in fl:
            picr = vtk.vtkPNGReader()
        elif ".jpg" in fl or ".jpeg" in fl:
            picr = vtk.vtkJPEGReader()
        elif ".bmp" in fl:
            picr = vtk.vtkBMPReader()
        picr.SetFileName(filename)
        picr.Update()
        actor = Picture()  # object derived from vtk.vtkImageActor()
        actor.SetInputData(picr.GetOutput())
        if alpha is None:
            alpha = 1
        actor.SetOpacity(alpha)

        ################################################################# multiblock:
    elif fl.endswith(".vtm") or fl.endswith(".vtmb"):
        read = vtk.vtkXMLMultiBlockDataReader()
        read.SetFileName(filename)
        read.Update()
        mb = read.GetOutput()
        if unpack:
            acts = []
            for i in range(mb.GetNumberOfBlocks()):
                b =  mb.GetBlock(i)
                if isinstance(b, (vtk.vtkPolyData,
                                  vtk.vtkImageData,
                                  vtk.vtkUnstructuredGrid,
                                  vtk.vtkStructuredGrid,
                                  vtk.vtkRectilinearGrid)):
                    acts.append(b)
            return acts
        else:
            return mb

        ################################################################# numpy:
    elif fl.endswith(".npy"):
        acts = loadNumpy(filename)
        if unpack == False:
            return Assembly(acts)
        return acts

    elif fl.endswith(".geojson") or fl.endswith(".geojson.gz"):
        return loadGeoJSON(fl)

        ################################################################# polygonal mesh:
    else:
        if fl.endswith(".vtk"): # read all legacy vtk types

            #output can be:
            # PolyData, StructuredGrid, StructuredPoints, UnstructuredGrid, RectilinearGrid
            reader = vtk.vtkDataSetReader()
            reader.ReadAllScalarsOn()
            reader.ReadAllVectorsOn()
            reader.ReadAllTensorsOn()
            reader.ReadAllFieldsOn()
            reader.ReadAllNormalsOn()
            reader.ReadAllColorScalarsOn()

        elif fl.endswith(".ply"):
            reader = vtk.vtkPLYReader()
        elif fl.endswith(".obj"):
            reader = vtk.vtkOBJReader()
        elif fl.endswith(".stl"):
            reader = vtk.vtkSTLReader()
        elif fl.endswith(".byu") or fl.endswith(".g"):
            reader = vtk.vtkBYUReader()
        elif fl.endswith(".foam"):  # OpenFoam
            reader = vtk.vtkOpenFOAMReader()
        elif fl.endswith(".pvd"):
            reader = vtk.vtkXMLGenericDataObjectReader()
        elif fl.endswith(".vtp"):
            reader = vtk.vtkXMLPolyDataReader()
        elif fl.endswith(".vts"):
            reader = vtk.vtkXMLStructuredGridReader()
        elif fl.endswith(".vtu"):
            reader = vtk.vtkXMLUnstructuredGridReader()
        elif fl.endswith(".vtr"):
            reader = vtk.vtkXMLRectilinearGridReader()
        elif fl.endswith(".pvtk"):
            reader = vtk.vtkPDataSetReader()
        elif fl.endswith(".pvtr"):
            reader = vtk.vtkXMLPRectilinearGridReader()
        elif fl.endswith("pvtu"):
            reader = vtk.vtkXMLPUnstructuredGridReader()
        elif fl.endswith(".txt") or fl.endswith(".xyz"):
            reader = vtk.vtkParticleReader()  # (format is x, y, z, scalar)
        elif fl.endswith(".facet"):
            reader = vtk.vtkFacetReader()
        else:
            return None

        reader.SetFileName(filename)
        reader.Update()
        routput = reader.GetOutput()

        if not routput:
            colors.printc("~noentry Unable to load", filename, c=1)
            return None

        actor = Actor(routput, c, alpha)
        if fl.endswith(".txt") or fl.endswith(".xyz"):
            actor.GetProperty().SetPointSize(4)

    actor.filename = filename
    return actor
def trimesh2vtk(inputobj, alphaPerCell=False):
    """
    Convert ``Trimesh`` object to ``Actor(vtkActor)`` or ``Assembly`` object.
    """
    if isSequence(inputobj):
        vms = []
        for ob in inputobj:
            vms.append(trimesh2vtk(ob))
        return vms

    # print('trimesh2vtk inputobj', type(inputobj))

    inputobj_type = str(type(inputobj))

    if "Trimesh" in inputobj_type or "primitives" in inputobj_type:
        from vtkplotter import Actor

        faces = inputobj.faces
        poly = buildPolyData(inputobj.vertices, faces)
        tact = Actor(poly)
        if inputobj.visual.kind == "face":
            trim_c = inputobj.visual.face_colors
        else:
            trim_c = inputobj.visual.vertex_colors

        if isSequence(trim_c):
            if isSequence(trim_c[0]):
                sameColor = len(np.unique(
                    trim_c, axis=0)) < 2  # all vtxs have same color
                trim_c = trim_c / 255

                if sameColor:
                    tact.c(trim_c[0, [0, 1, 2]]).alpha(trim_c[0, 3])
                else:
                    if inputobj.visual.kind == "face":
                        tact.cellColors(trim_c[:, [0, 1, 2]],
                                        mode='colors',
                                        alpha=trim_c[:, 3],
                                        alphaPerCell=alphaPerCell)
                    else:
                        tact.pointColors(trim_c[:, [0, 1, 2]],
                                         mode='colors',
                                         alpha=trim_c[3])
        return tact

    elif "PointCloud" in inputobj_type:
        from vtkplotter.shapes import Points

        trim_cc, trim_al = "black", 1
        if hasattr(inputobj, "vertices_color"):
            trim_c = inputobj.vertices_color
            if len(trim_c):
                trim_cc = trim_c[:, [0, 1, 2]] / 255
                trim_al = trim_c[:, 3] / 255
                trim_al = np.sum(trim_al) / len(trim_al)  # just the average
        return Points(inputobj.vertices, r=8, c=trim_cc, alpha=trim_al)

    elif "path" in inputobj_type:
        from vtkplotter.shapes import Line
        from vtkplotter.actors import Assembly

        lines = []
        for e in inputobj.entities:
            # print('trimesh entity', e.to_dict())
            l = Line(inputobj.vertices[e.points], c="k", lw=2)
            lines.append(l)
        return Assembly(lines)

    return None
def addScalarBar3D(
    obj=None,
    at=0,
    pos=(0, 0, 0),
    normal=(0, 0, 1),
    sx=0.1,
    sy=2,
    nlabels=9,
    ncols=256,
    cmap=None,
    c=None,
    alpha=1,
):
    """Draw a 3D scalar bar.

    ``obj`` input can be:
        - a list of numbers,
        - a list of two numbers in the form `(min, max)`,
        - a ``vtkActor`` already containing a set of scalars associated to vertices or cells,
        - if ``None`` the last actor in the list of actors will be used.

    .. hint:: |scalbar| |mesh_coloring.py|_
    """
    from vtk.util.numpy_support import vtk_to_numpy, numpy_to_vtk

    vp = settings.plotter_instance
    if c is None:  # automatic black or white
        c = (0.8, 0.8, 0.8)
        if numpy.sum(colors.getColor(vp.backgrcol)) > 1.5:
            c = (0.2, 0.2, 0.2)
    c = colors.getColor(c)

    gap = 0.4  # space btw nrs and scale
    vtkscalars_name = ""
    if obj is None:
        obj = vp.lastActor()
    if isinstance(obj, vtk.vtkActor):
        poly = obj.GetMapper().GetInput()
        vtkscalars = poly.GetPointData().GetScalars()
        if vtkscalars is None:
            vtkscalars = poly.GetCellData().GetScalars()
        if vtkscalars is None:
            print("Error in addScalarBar3D: actor has no scalar array.", [obj])
            exit()
        npscalars = vtk_to_numpy(vtkscalars)
        vmin, vmax = numpy.min(npscalars), numpy.max(npscalars)
        vtkscalars_name = vtkscalars.GetName().split("_")[-1]
    elif utils.isSequence(obj):
        vmin, vmax = numpy.min(obj), numpy.max(obj)
        vtkscalars_name = "jet"
    else:
        print("Error in addScalarBar3D(): input must be vtkActor or list.",
              type(obj))
        exit()

    if cmap is None:
        cmap = vtkscalars_name

    # build the color scale part
    scale = shapes.Grid([-sx * gap, 0, 0],
                        c=c,
                        alpha=alpha,
                        sx=sx,
                        sy=sy,
                        resx=1,
                        resy=ncols)
    scale.GetProperty().SetRepresentationToSurface()
    cscals = scale.cellCenters()[:, 1]

    def _cellColors(scale, scalars, cmap, alpha):
        mapper = scale.GetMapper()
        cpoly = mapper.GetInput()
        n = len(scalars)
        lut = vtk.vtkLookupTable()
        lut.SetNumberOfTableValues(n)
        lut.Build()
        for i in range(n):
            r, g, b = colors.colorMap(i, cmap, 0, n)
            lut.SetTableValue(i, r, g, b, alpha)
        arr = numpy_to_vtk(numpy.ascontiguousarray(scalars), deep=True)
        vmin, vmax = numpy.min(scalars), numpy.max(scalars)
        mapper.SetScalarRange(vmin, vmax)
        mapper.SetLookupTable(lut)
        mapper.ScalarVisibilityOn()
        cpoly.GetCellData().SetScalars(arr)

    _cellColors(scale, cscals, cmap, alpha)

    # build text
    nlabels = numpy.min([nlabels, ncols])
    tlabs = numpy.linspace(vmin, vmax, num=nlabels, endpoint=True)
    tacts = []
    prec = (vmax - vmin) / abs(vmax + vmin) * 2
    prec = int(3 + abs(numpy.log10(prec + 1)))
    for i, t in enumerate(tlabs):
        tx = utils.precision(t, prec)
        y = -sy / 1.98 + sy * i / (nlabels - 1)
        a = shapes.Text(tx,
                        pos=[sx * gap, y, 0],
                        s=sy / 50,
                        c=c,
                        alpha=alpha,
                        depth=0)
        a.PickableOff()
        tacts.append(a)
    sact = Assembly([scale] + tacts)
    nax = numpy.linalg.norm(normal)
    if nax:
        normal = numpy.array(normal) / nax
    theta = numpy.arccos(normal[2])
    phi = numpy.arctan2(normal[1], normal[0])
    sact.RotateZ(numpy.rad2deg(phi))
    sact.RotateY(numpy.rad2deg(theta))
    sact.SetPosition(pos)
    if not vp.renderers[at]:
        save_int = vp.interactive
        vp.show(interactive=0)
        vp.interactive = save_int
    vp.renderers[at].AddActor(sact)
    vp.renderers[at].Render()
    sact.PickableOff()
    vp.scalarbars.append(sact)
    if isinstance(obj, Actor):
        obj.scalarbar_actor = sact
    return sact
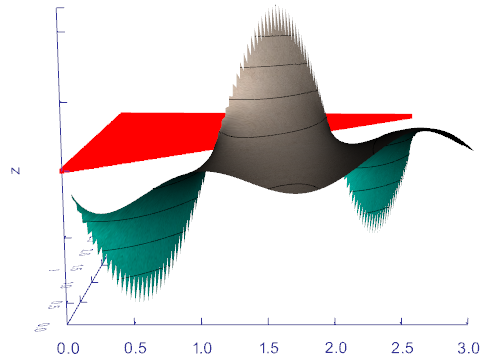
def fxy(
        z="sin(3*x)*log(x-y)/3",
        x=(0, 3),
        y=(0, 3),
        zlimits=(None, None),
        showNan=True,
        zlevels=10,
        c="b",
        bc="aqua",
        alpha=1,
        texture="paper",
        res=(100, 100),
):
    """
    Build a surface representing the function :math:`f(x,y)` specified as a string
    or as a reference to an external function.

    :param float x: x range of values.
    :param float y: y range of values.
    :param float zlimits: limit the z range of the independent variable.
    :param int zlevels: will draw the specified number of z-levels contour lines.
    :param bool showNan: show where the function does not exist as red points.
    :param list res: resolution in x and y.

    |fxy| |fxy.py|_

        Function is: :math:`f(x,y)=\sin(3x) \cdot \log(x-y)/3` in range :math:`x=[0,3], y=[0,3]`.
    """
    if isinstance(z, str):
        try:
            z = z.replace("math.", "").replace("np.", "")
            namespace = locals()
            code = "from math import*\ndef zfunc(x,y): return " + z
            exec(code, namespace)
            z = namespace["zfunc"]
        except:
            colors.printc("Syntax Error in fxy()", c=1)
            return None

    ps = vtk.vtkPlaneSource()
    ps.SetResolution(res[0], res[1])
    ps.SetNormal([0, 0, 1])
    ps.Update()
    poly = ps.GetOutput()
    dx = x[1] - x[0]
    dy = y[1] - y[0]
    todel, nans = [], []

    for i in range(poly.GetNumberOfPoints()):
        px, py, _ = poly.GetPoint(i)
        xv = (px + 0.5) * dx + x[0]
        yv = (py + 0.5) * dy + y[0]
        try:
            zv = z(xv, yv)
        except:
            zv = 0
            todel.append(i)
            nans.append([xv, yv, 0])
        poly.GetPoints().SetPoint(i, [xv, yv, zv])

    if len(todel):
        cellIds = vtk.vtkIdList()
        poly.BuildLinks()
        for i in todel:
            poly.GetPointCells(i, cellIds)
            for j in range(cellIds.GetNumberOfIds()):
                poly.DeleteCell(cellIds.GetId(j))  # flag cell
        poly.RemoveDeletedCells()
        cl = vtk.vtkCleanPolyData()
        cl.SetInputData(poly)
        cl.Update()
        poly = cl.GetOutput()

    if not poly.GetNumberOfPoints():
        colors.printc("Function is not real in the domain", c=1)
        return None

    if zlimits[0]:
        tmpact1 = Actor(poly)
        a = tmpact1.cutWithPlane((0, 0, zlimits[0]), (0, 0, 1))
        poly = a.polydata()
    if zlimits[1]:
        tmpact2 = Actor(poly)
        a = tmpact2.cutWithPlane((0, 0, zlimits[1]), (0, 0, -1))
        poly = a.polydata()

    if c is None:
        elev = vtk.vtkElevationFilter()
        elev.SetInputData(poly)
        elev.Update()
        poly = elev.GetOutput()

    actor = Actor(poly, c, alpha).computeNormals().lighting("plastic")
    if c is None:
        actor.scalars("Elevation")

    if bc:
        actor.bc(bc)

    actor.texture(texture)

    acts = [actor]
    if zlevels:
        elevation = vtk.vtkElevationFilter()
        elevation.SetInputData(poly)
        bounds = poly.GetBounds()
        elevation.SetLowPoint(0, 0, bounds[4])
        elevation.SetHighPoint(0, 0, bounds[5])
        elevation.Update()
        bcf = vtk.vtkBandedPolyDataContourFilter()
        bcf.SetInputData(elevation.GetOutput())
        bcf.SetScalarModeToValue()
        bcf.GenerateContourEdgesOn()
        bcf.GenerateValues(zlevels, elevation.GetScalarRange())
        bcf.Update()
        zpoly = bcf.GetContourEdgesOutput()
        zbandsact = Actor(zpoly, "k", alpha).lw(0.5)
        acts.append(zbandsact)

    if showNan and len(todel):
        bb = actor.GetBounds()
        if bb[4] <= 0 and bb[5] >= 0:
            zm = 0.0
        else:
            zm = (bb[4] + bb[5]) / 2
        nans = np.array(nans) + [0, 0, zm]
        nansact = shapes.Points(nans, r=2, c="red", alpha=alpha)
        nansact.GetProperty().RenderPointsAsSpheresOff()
        acts.append(nansact)

    if len(acts) > 1:
        return Assembly(acts)
    else:
        return actor
def plotxy(
    data,
    xlimits=None,
    ylimits=None,
    xscale=1,
    yscale=None,
    xlogscale=False,
    ylogscale=False,
    c="k",
    alpha=1,
    xtitle="x",
    ytitle="y",
    title="",
    titleSize=None,
    lc="k",
    lw=2,
    dashed=False,
    splined=False,
    marker=None,
    ms=None,
    mc=None,
    ma=None,
):
    """Draw a 2D plot of variable x vs y.

    """

    if len(data) == 2 and len(data[0]) > 1 and len(data[0]) == len(data[1]):
        data = np.c_[data[0], data[1]]

    if xlimits is not None:
        cdata = []
        x0lim = xlimits[0]
        x1lim = xlimits[1]
        for d in data:
            if d[0] > x0lim and d[0] < x1lim:
                cdata.append(d)
        data = cdata
        if not len(data):
            colors.printc("Error in plotxy(): no points within xlimits", c=1)
            return None

    if ylimits is not None:
        cdata = []
        y0lim = ylimits[0]
        y1lim = ylimits[1]
        for d in data:
            if d[1] > y0lim and d[1] < y1lim:
                cdata.append(d)
        data = cdata
        if not len(data):
            colors.printc("Error in plotxy(): no points within ylimits", c=1)
            return None

    data = np.array(data)[:, [0, 1]]

    if xlogscale:
        data[:, 0] = np.log(data[:, 0])

    if ylogscale:
        data[:, 1] = np.log(data[:, 1])

    x0, y0 = np.min(data, axis=0)
    x1, y1 = np.max(data, axis=0)

    if yscale is None:
        yscale = (x1 - x0) / (y1 - y0) * 0.75  # default 3/4 aspect ratio
        yscale = float(utils.precision(yscale, 1))
        if abs(yscale - 1) > 0.2:
            ytitle += " *" + str(yscale)
            y0 *= yscale
            y1 *= yscale
        else:
            yscale = 1

    scale = np.array([[xscale, yscale]])
    data = np.multiply(data, scale)

    acts = []
    if dashed:
        l = shapes.DashedLine(data, lw=lw, spacing=20)
    elif splined:
        l = shapes.KSpline(data).lw(lw).c(lc)
    else:
        l = shapes.Line(data, lw=lw, c=lc)
    acts.append(l)

    if marker:
        if ms is None:
            ms = (x1 - x0) / 75.0
        if mc is None:
            mc = lc
        mk = shapes.Marker(marker, s=ms, alpha=ma)
        pts = shapes.Points(data)
        marked = shapes.Glyph(pts, glyphObj=mk, c=mc)
        acts.append(marked)

    x0lim = x0
    x1lim = x1
    y0lim = y0 * yscale
    y1lim = y1 * yscale
    if xlimits is not None or ylimits is not None:
        if xlimits is not None:
            x0lim = min(xlimits[0], x0)
            x1lim = max(xlimits[1], x1)
        if ylimits is not None:
            y0lim = min(ylimits[0] * yscale, y0)
            y1lim = max(ylimits[1] * yscale, y1)
        rec = shapes.Rectangle([x0lim, y0lim, 0], [x1lim, y1lim, 0])
        rec.alpha(0).wireframe()
        acts.append(rec)

    if title:
        if titleSize is None:
            titleSize = (x1lim - x0lim) / 40.0
        tit = shapes.Text(
            title,
            s=titleSize,
            c=c,
            depth=0,
            alpha=alpha,
            pos=((x1lim + x0lim) / 2.0, y1lim, 0),
            justify="bottom-center",
        )
        tit.pickable(False)
        acts.append(tit)

    settings.xtitle = xtitle
    settings.ytitle = ytitle
    asse = Assembly(acts)
    asse.info["yscale"] = yscale
    return asse
def hexHistogram(
    xvalues,
    yvalues,
    xtitle="",
    ytitle="",
    ztitle="",
    bins=12,
    norm=1,
    fill=True,
    c=None,
    cmap="terrain_r",
    alpha=1,
):
    """
    Build a hexagonal histogram from a list of x and y values.

    :param bool bins: nr of bins for the smaller range in x or y.
    :param float norm: sets a scaling factor for the z axis (freq. axis).
    :param bool fill: draw solid hexagons.
    :param str cmap: color map name for elevation.

    |histoHexagonal| |histoHexagonal.py|_
    """
    if xtitle:
        from vtkplotter import settings

        settings.xtitle = xtitle
    if ytitle:
        from vtkplotter import settings

        settings.ytitle = ytitle
    if ztitle:
        from vtkplotter import settings

        settings.ztitle = ztitle

    xmin, xmax = np.min(xvalues), np.max(xvalues)
    ymin, ymax = np.min(yvalues), np.max(yvalues)
    dx, dy = xmax - xmin, ymax - ymin

    if xmax - xmin < ymax - ymin:
        n = bins
        m = np.rint(dy / dx * n / 1.2 + 0.5).astype(int)
    else:
        m = bins
        n = np.rint(dx / dy * m * 1.2 + 0.5).astype(int)

    src = vtk.vtkPointSource()
    src.SetNumberOfPoints(len(xvalues))
    src.Update()
    pointsPolydata = src.GetOutput()

    #values = list(zip(xvalues, yvalues))
    values = np.stack((xvalues, yvalues), axis=1)
    zs = [[0.0]] * len(values)
    values = np.append(values, zs, axis=1)

    pointsPolydata.GetPoints().SetData(numpy_to_vtk(values, deep=True))
    cloud = Actor(pointsPolydata)

    col = None
    if c is not None:
        col = colors.getColor(c)

    hexs, binmax = [], 0
    ki, kj = 1.33, 1.12
    r = 0.47 / n * 1.2 * dx
    for i in range(n + 3):
        for j in range(m + 2):
            cyl = vtk.vtkCylinderSource()
            cyl.SetResolution(6)
            cyl.CappingOn()
            cyl.SetRadius(0.5)
            cyl.SetHeight(0.1)
            cyl.Update()
            t = vtk.vtkTransform()
            if not i % 2:
                p = (i / ki, j / kj, 0)
            else:
                p = (i / ki, j / kj + 0.45, 0)
            q = (p[0] / n * 1.2 * dx + xmin, p[1] / m * dy + ymin, 0)
            ids = cloud.closestPoint(q, radius=r, returnIds=True)
            ne = len(ids)
            if fill:
                t.Translate(p[0], p[1], ne / 2)
                t.Scale(1, 1, ne * 10)
            else:
                t.Translate(p[0], p[1], ne)
            t.RotateX(90)  # put it along Z
            tf = vtk.vtkTransformPolyDataFilter()
            tf.SetInputData(cyl.GetOutput())
            tf.SetTransform(t)
            tf.Update()
            if c is None:
                col = i
            h = Actor(tf.GetOutput(), c=col, alpha=alpha).flat()
            h.GetProperty().SetSpecular(0)
            h.GetProperty().SetDiffuse(1)
            h.PickableOff()
            hexs.append(h)
            if ne > binmax:
                binmax = ne

    if cmap is not None:
        for h in hexs:
            z = h.GetBounds()[5]
            col = colors.colorMap(z, cmap, 0, binmax)
            h.color(col)

    asse = Assembly(hexs)
    asse.SetScale(1.2 / n * dx, 1 / m * dy, norm / binmax * (dx + dy) / 4)
    asse.SetPosition(xmin, ymin, 0)
    return asse
def histogram(
    values,
    xtitle="",
    ytitle="",
    bins=25,
    vrange=None,
    logscale=False,
    yscale=None,
    fill=True,
    gap=0.02,
    c="olivedrab",
    alpha=1,
    outline=True,
    lw=2,
    lc="black",
    errors=False,
):
    """
    Build a histogram from a list of values in n bins.
    The resulting object is a 2D actor.

    :param int bins: number of bins.
    :param list vrange: restrict the range of the histogram.
    :param bool logscale: use logscale on y-axis.
    :param bool fill: fill bars woth solid color `c`.
    :param float gap: leave a small space btw bars.
    :param bool outline: show outline of the bins.
    :param bool errors: show error bars.

    |histogram| |histogram.py|_
    """
    if xtitle:
        from vtkplotter import settings

        settings.xtitle = xtitle
    if ytitle:
        from vtkplotter import settings

        settings.ytitle = ytitle

    fs, edges = np.histogram(values, bins=bins, range=vrange)
    if logscale:
        fs = np.log10(fs + 1)
    mine, maxe = np.min(edges), np.max(edges)
    binsize = edges[1] - edges[0]

    rs = []
    if fill:
        if outline:
            gap = 0
        for i in range(bins):
            p0 = (edges[i] + gap * binsize, 0, 0)
            p1 = (edges[i + 1] - gap * binsize, fs[i], 0)
            r = shapes.Rectangle(p0, p1)
            r.color(c).alpha(alpha).lighting("ambient")
            rs.append(r)

    if outline:
        lns = [[mine, 0, 0]]
        for i in range(bins):
            lns.append([edges[i], fs[i], 0])
            lns.append([edges[i + 1], fs[i], 0])
        lns.append([maxe, 0, 0])
        rs.append(shapes.Line(lns, c=lc, alpha=alpha, lw=lw))

    if errors:
        errs = np.sqrt(fs)
        for i in range(bins):
            x = (edges[i] + edges[i + 1]) / 2
            el = shapes.Line(
                [x, fs[i] - errs[i] / 2, 0.1 * binsize],
                [x, fs[i] + errs[i] / 2, 0.1 * binsize],
                c=lc,
                alpha=alpha,
                lw=lw,
            )
            pt = shapes.Point([x, fs[i], 0.1 * binsize],
                              r=7,
                              c=lc,
                              alpha=alpha)
            rs.append(el)
            rs.append(pt)

    asse = Assembly(rs)
    if yscale is None:
        yscale = 10 / np.sum(fs) * (maxe - mine)
    asse.scale([1, yscale, 1])
    return asse
def addAxes(axtype=None, c=None):
"""Draw axes on scene. Available axes types:
:param int axtype:
- 0, no axes,
- 1, draw three gray grid walls
- 2, show cartesian axes from (0,0,0)
- 3, show positive range of cartesian axes from (0,0,0)
- 4, show a triad at bottom left
- 5, show a cube at bottom left
- 6, mark the corners of the bounding box
- 7, draw a simple ruler at the bottom of the window
- 8, show the ``vtkCubeAxesActor`` object
- 9, show the bounding box outLine
- 10, show three circles representing the maximum bounding box
"""
vp = settings.plotter_instance
if axtype is not None:
vp.axes = axtype # overrride
r = vp.renderers.index(vp.renderer)
if not vp.axes:
return
if c is None: # automatic black or white
c = (0.9, 0.9, 0.9)
if numpy.sum(vp.renderer.GetBackground()) > 1.5:
c = (0.1, 0.1, 0.1)
if not vp.renderer:
return
if vp.axes_exist[r]:
return
# calculate max actors bounds
bns = []
for a in vp.actors:
if a and a.GetPickable():
b = a.GetBounds()
if b:
bns.append(b)
if len(bns):
max_bns = numpy.max(bns, axis=0)
min_bns = numpy.min(bns, axis=0)
vbb = (min_bns[0], max_bns[1], min_bns[2], max_bns[3], min_bns[4],
max_bns[5])
else:
vbb = vp.renderer.ComputeVisiblePropBounds()
max_bns = vbb
min_bns = vbb
sizes = (max_bns[1] - min_bns[0], max_bns[3] - min_bns[2],
max_bns[5] - min_bns[4])
############################################################
if vp.axes == 1 or vp.axes == True: # gray grid walls
nd = 4 # number of divisions in the smallest axis
off = -0.04 # label offset
step = numpy.min(sizes) / nd
if not step:
# bad proportions, use vtkCubeAxesActor
vp.addAxes(axtype=8, c=c)
vp.axes = 1
return
rx, ry, rz = numpy.rint(sizes / step).astype(int)
if max([rx / ry, ry / rx, rx / rz, rz / rx, ry / rz, rz / ry]) > 15:
# bad proportions, use vtkCubeAxesActor
vp.addAxes(axtype=8, c=c)
vp.axes = 1
return
gxy = shapes.Grid(pos=(0.5, 0.5, 0),
normal=[0, 0, 1],
bc=None,
resx=rx,
resy=ry)
gxz = shapes.Grid(pos=(0.5, 0, 0.5),
normal=[0, 1, 0],
bc=None,
resx=rz,
resy=rx)
gyz = shapes.Grid(pos=(0, 0.5, 0.5),
normal=[1, 0, 0],
bc=None,
resx=rz,
resy=ry)
gxy.alpha(0.06).wire(False).color(c).lineWidth(1)
gxz.alpha(0.04).wire(False).color(c).lineWidth(1)
gyz.alpha(0.04).wire(False).color(c).lineWidth(1)
xa = shapes.Line([0, 0, 0], [1, 0, 0], c=c, lw=1)
ya = shapes.Line([0, 0, 0], [0, 1, 0], c=c, lw=1)
za = shapes.Line([0, 0, 0], [0, 0, 1], c=c, lw=1)
xt, yt, zt, ox, oy, oz = [None] * 6
if vp.xtitle:
xtitle = vp.xtitle
if min_bns[0] <= 0 and max_bns[1] > 0: # mark x origin
ox = shapes.Cube([-min_bns[0] / sizes[0], 0, 0],
side=0.008,
c=c)
if len(vp.xtitle) == 1: # add axis length info
xtitle = vp.xtitle + " /" + utils.precision(sizes[0], 4)
wpos = [1 - (len(vp.xtitle) + 1) / 40, off, 0]
xt = shapes.Text(xtitle,
pos=wpos,
normal=(0, 0, 1),
s=0.025,
c=c,
justify="bottom-right")
if vp.ytitle:
if min_bns[2] <= 0 and max_bns[3] > 0: # mark y origin
oy = shapes.Cube([0, -min_bns[2] / sizes[1], 0],
side=0.008,
c=c)
yt = shapes.Text(vp.ytitle,
pos=(0, 0, 0),
normal=(0, 0, 1),
s=0.025,
c=c,
justify="bottom-right")
if len(vp.ytitle) == 1:
wpos = [off, 1 - (len(vp.ytitle) + 1) / 40, 0]
yt.pos(wpos)
else:
wpos = [off * 0.7, 1 - (len(vp.ytitle) + 1) / 40, 0]
yt.rotateZ(90).pos(wpos)
if vp.ztitle:
if min_bns[4] <= 0 and max_bns[5] > 0: # mark z origin
oz = shapes.Cube([0, 0, -min_bns[4] / sizes[2]],
side=0.008,
c=c)
zt = shapes.Text(vp.ztitle,
pos=(0, 0, 0),
normal=(1, -1, 0),
s=0.025,
c=c,
justify="bottom-right")
if len(vp.ztitle) == 1:
wpos = [off * 0.6, off * 0.6, 1 - (len(vp.ztitle) + 1) / 40]
zt.rotate(90, (1, -1, 0)).pos(wpos)
else:
wpos = [off * 0.3, off * 0.3, 1 - (len(vp.ztitle) + 1) / 40]
zt.rotate(180, (1, -1, 0)).pos(wpos)
acts = [gxy, gxz, gyz, xa, ya, za, xt, yt, zt, ox, oy, oz]
for a in acts:
if a:
a.PickableOff()
aa = Assembly(acts)
aa.pos(min_bns[0], min_bns[2], min_bns[4])
aa.SetScale(sizes)
aa.PickableOff()
vp.renderer.AddActor(aa)
vp.axes_exist[r] = aa
elif vp.axes == 2 or vp.axes == 3:
vbb = vp.renderer.ComputeVisiblePropBounds() # to be double checked
xcol, ycol, zcol = "db", "dg", "dr"
s = 1
alpha = 1
centered = False
x0, x1, y0, y1, z0, z1 = vbb
dx, dy, dz = x1 - x0, y1 - y0, z1 - z0
aves = numpy.sqrt(dx * dx + dy * dy + dz * dz) / 2
x0, x1 = min(x0, 0), max(x1, 0)
y0, y1 = min(y0, 0), max(y1, 0)
z0, z1 = min(z0, 0), max(z1, 0)
if vp.axes == 3:
if x1 > 0:
x0 = 0
if y1 > 0:
y0 = 0
if z1 > 0:
z0 = 0
dx, dy, dz = x1 - x0, y1 - y0, z1 - z0
acts = []
if x0 * x1 <= 0 or y0 * z1 <= 0 or z0 * z1 <= 0: # some ranges contain origin
zero = shapes.Sphere(r=aves / 120 * s, c="k", alpha=alpha, res=10)
acts += [zero]
if len(vp.xtitle) and dx > aves / 100:
xl = shapes.Cylinder([[x0, 0, 0], [x1, 0, 0]],
r=aves / 250 * s,
c=xcol,
alpha=alpha)
xc = shapes.Cone(pos=[x1, 0, 0],
c=xcol,
alpha=alpha,
r=aves / 100 * s,
height=aves / 25 * s,
axis=[1, 0, 0],
res=10)
wpos = [
x1 - (len(vp.xtitle) + 1) * aves / 40 * s, -aves / 25 * s, 0
] # aligned to arrow tip
if centered:
wpos = [(x0 + x1) / 2 - len(vp.xtitle) / 2 * aves / 40 * s,
-aves / 25 * s, 0]
xt = shapes.Text(vp.xtitle,
pos=wpos,
normal=(0, 0, 1),
s=aves / 40 * s,
c=xcol)
acts += [xl, xc, xt]
if len(vp.ytitle) and dy > aves / 100:
yl = shapes.Cylinder([[0, y0, 0], [0, y1, 0]],
r=aves / 250 * s,
c=ycol,
alpha=alpha)
yc = shapes.Cone(pos=[0, y1, 0],
c=ycol,
alpha=alpha,
r=aves / 100 * s,
height=aves / 25 * s,
axis=[0, 1, 0],
res=10)
wpos = [
-aves / 40 * s, y1 - (len(vp.ytitle) + 1) * aves / 40 * s, 0
]
if centered:
wpos = [
-aves / 40 * s,
(y0 + y1) / 2 - len(vp.ytitle) / 2 * aves / 40 * s, 0
]
yt = shapes.Text(vp.ytitle,
pos=(0, 0, 0),
normal=(0, 0, 1),
s=aves / 40 * s,
c=ycol)
yt.rotate(90, [0, 0, 1]).pos(wpos)
acts += [yl, yc, yt]
if len(vp.ztitle) and dz > aves / 100:
zl = shapes.Cylinder([[0, 0, z0], [0, 0, z1]],
r=aves / 250 * s,
c=zcol,
alpha=alpha)
zc = shapes.Cone(pos=[0, 0, z1],
c=zcol,
alpha=alpha,
r=aves / 100 * s,
height=aves / 25 * s,
axis=[0, 0, 1],
res=10)
wpos = [
-aves / 50 * s, -aves / 50 * s,
z1 - (len(vp.ztitle) + 1) * aves / 40 * s
]
if centered:
wpos = [
-aves / 50 * s, -aves / 50 * s,
(z0 + z1) / 2 - len(vp.ztitle) / 2 * aves / 40 * s
]
zt = shapes.Text(vp.ztitle,
pos=(0, 0, 0),
normal=(1, -1, 0),
s=aves / 40 * s,
c=zcol)
zt.rotate(180, (1, -1, 0)).pos(wpos)
acts += [zl, zc, zt]
for a in acts:
a.PickableOff()
ass = Assembly(acts)
ass.PickableOff()
vp.renderer.AddActor(ass)
vp.axes_exist[r] = ass
elif vp.axes == 4:
axact = vtk.vtkAxesActor()
axact.SetShaftTypeToCylinder()
axact.SetCylinderRadius(0.03)
axact.SetXAxisLabelText(vp.xtitle)
axact.SetYAxisLabelText(vp.ytitle)
axact.SetZAxisLabelText(vp.ztitle)
axact.GetXAxisShaftProperty().SetColor(0, 0, 1)
axact.GetZAxisShaftProperty().SetColor(1, 0, 0)
axact.GetXAxisTipProperty().SetColor(0, 0, 1)
axact.GetZAxisTipProperty().SetColor(1, 0, 0)
bc = numpy.array(vp.renderer.GetBackground())
if numpy.sum(bc) < 1.5:
lc = (1, 1, 1)
else:
lc = (0, 0, 0)
axact.GetXAxisCaptionActor2D().GetCaptionTextProperty().BoldOff()
axact.GetYAxisCaptionActor2D().GetCaptionTextProperty().BoldOff()
axact.GetZAxisCaptionActor2D().GetCaptionTextProperty().BoldOff()
axact.GetXAxisCaptionActor2D().GetCaptionTextProperty().ItalicOff()
axact.GetYAxisCaptionActor2D().GetCaptionTextProperty().ItalicOff()
axact.GetZAxisCaptionActor2D().GetCaptionTextProperty().ItalicOff()
axact.GetXAxisCaptionActor2D().GetCaptionTextProperty().ShadowOff()
axact.GetYAxisCaptionActor2D().GetCaptionTextProperty().ShadowOff()
axact.GetZAxisCaptionActor2D().GetCaptionTextProperty().ShadowOff()
axact.GetXAxisCaptionActor2D().GetCaptionTextProperty().SetColor(lc)
axact.GetYAxisCaptionActor2D().GetCaptionTextProperty().SetColor(lc)
axact.GetZAxisCaptionActor2D().GetCaptionTextProperty().SetColor(lc)
axact.PickableOff()
icn = addIcon(axact, size=0.1)
vp.axes_exist[r] = icn
elif vp.axes == 5:
axact = vtk.vtkAnnotatedCubeActor()
axact.GetCubeProperty().SetColor(0.75, 0.75, 0.75)
axact.SetTextEdgesVisibility(0)
axact.SetFaceTextScale(0.4)
axact.GetXPlusFaceProperty().SetColor(colors.getColor("b"))
axact.GetXMinusFaceProperty().SetColor(colors.getColor("db"))
axact.GetYPlusFaceProperty().SetColor(colors.getColor("g"))
axact.GetYMinusFaceProperty().SetColor(colors.getColor("dg"))
axact.GetZPlusFaceProperty().SetColor(colors.getColor("r"))
axact.GetZMinusFaceProperty().SetColor(colors.getColor("dr"))
axact.PickableOff()
icn = addIcon(axact, size=0.06)
vp.axes_exist[r] = icn
elif vp.axes == 6:
ocf = vtk.vtkOutlineCornerFilter()
ocf.SetCornerFactor(0.1)
largestact, sz = None, -1
for a in vp.actors:
if a.GetPickable():
b = a.GetBounds()
d = max(b[1] - b[0], b[3] - b[2], b[5] - b[4])
if sz < d:
largestact = a
sz = d
if isinstance(largestact, Assembly):
ocf.SetInputData(largestact.getActor(0).GetMapper().GetInput())
else:
ocf.SetInputData(largestact.polydata())
ocf.Update()
ocMapper = vtk.vtkHierarchicalPolyDataMapper()
ocMapper.SetInputConnection(0, ocf.GetOutputPort(0))
ocActor = vtk.vtkActor()
ocActor.SetMapper(ocMapper)
bc = numpy.array(vp.renderer.GetBackground())
if numpy.sum(bc) < 1.5:
lc = (1, 1, 1)
else:
lc = (0, 0, 0)
ocActor.GetProperty().SetColor(lc)
ocActor.PickableOff()
vp.renderer.AddActor(ocActor)
vp.axes_exist[r] = ocActor
elif vp.axes == 7:
# draws a simple ruler at the bottom of the window
ls = vtk.vtkLegendScaleActor()
ls.RightAxisVisibilityOff()
ls.TopAxisVisibilityOff()
ls.LegendVisibilityOff()
ls.LeftAxisVisibilityOff()
ls.GetBottomAxis().SetNumberOfMinorTicks(1)
ls.GetBottomAxis().GetProperty().SetColor(c)
ls.GetBottomAxis().GetLabelTextProperty().SetColor(c)
ls.GetBottomAxis().GetLabelTextProperty().BoldOff()
ls.GetBottomAxis().GetLabelTextProperty().ItalicOff()
ls.GetBottomAxis().GetLabelTextProperty().ShadowOff()
ls.PickableOff()
vp.renderer.AddActor(ls)
vp.axes_exist[r] = ls
elif vp.axes == 8:
ca = vtk.vtkCubeAxesActor()
ca.SetBounds(vbb)
if vp.camera:
ca.SetCamera(vp.camera)
else:
ca.SetCamera(vp.renderer.GetActiveCamera())
ca.GetXAxesLinesProperty().SetColor(c)
ca.GetYAxesLinesProperty().SetColor(c)
ca.GetZAxesLinesProperty().SetColor(c)
for i in range(3):
ca.GetLabelTextProperty(i).SetColor(c)
ca.GetTitleTextProperty(i).SetColor(c)
ca.SetTitleOffset(5)
ca.SetFlyMode(3)
ca.SetXTitle(vp.xtitle)
ca.SetYTitle(vp.ytitle)
ca.SetZTitle(vp.ztitle)
if vp.xtitle == "":
ca.SetXAxisVisibility(0)
ca.XAxisLabelVisibilityOff()
if vp.ytitle == "":
ca.SetYAxisVisibility(0)
ca.YAxisLabelVisibilityOff()
if vp.ztitle == "":
ca.SetZAxisVisibility(0)
ca.ZAxisLabelVisibilityOff()
ca.PickableOff()
vp.renderer.AddActor(ca)
vp.axes_exist[r] = ca
return
elif vp.axes == 9:
src = vtk.vtkCubeSource()
src.SetXLength(vbb[1] - vbb[0])
src.SetYLength(vbb[3] - vbb[2])
src.SetZLength(vbb[5] - vbb[4])
src.Update()
ca = Actor(src.GetOutput(), c=c, alpha=0.5, wire=1)
ca.pos((vbb[0] + vbb[1]) / 2, (vbb[3] + vbb[2]) / 2,
(vbb[5] + vbb[4]) / 2)
ca.PickableOff()
vp.renderer.AddActor(ca)
vp.axes_exist[r] = ca
elif vp.axes == 10:
x0 = (vbb[0] + vbb[1]) / 2, (vbb[3] + vbb[2]) / 2, (vbb[5] +
vbb[4]) / 2
rx, ry, rz = (vbb[1] - vbb[0]) / 2, (vbb[3] - vbb[2]) / 2, (vbb[5] -
vbb[4]) / 2
rm = max(rx, ry, rz)
xc = shapes.Disc(x0, (0, 0, 1),
r1=rm,
r2=rm,
c='lr',
bc=None,
res=1,
resphi=72)
yc = shapes.Disc(x0, (0, 1, 0),
r1=rm,
r2=rm,
c='lg',
bc=None,
res=1,
resphi=72)
zc = shapes.Disc(x0, (1, 0, 0),
r1=rm,
r2=rm,
c='lb',
bc=None,
res=1,
resphi=72)
xc.clean().alpha(0.2).wire().lineWidth(2.5).PickableOff()
yc.clean().alpha(0.2).wire().lineWidth(2.5).PickableOff()
zc.clean().alpha(0.2).wire().lineWidth(2.5).PickableOff()
ca = xc + yc + zc
ca.PickableOff()
vp.renderer.AddActor(ca)
vp.axes_exist[r] = ca
else:
colors.printc('~bomb Keyword axes must be in range [0-10].', c=1)
colors.printc('''
~target Available axes types:
0 = no axes,
1 = draw three gray grid walls
2 = show cartesian axes from (0,0,0)
3 = show positive range of cartesian axes from (0,0,0)
4 = show a triad at bottom left
5 = show a cube at bottom left
6 = mark the corners of the bounding box
7 = draw a simple ruler at the bottom of the window
8 = show the vtkCubeAxesActor object
9 = show the bounding box outline
10 = show three circles representing the maximum bounding box
''',
c=1,
bold=0)
if not vp.axes_exist[r]:
vp.axes_exist[r] = True
return
def smoothMLS1D(actor, f=0.2, showNLines=0):
'''
Smooth actor or points with a Moving Least Squares variant.
The list actor.variances contain the residue calculated for each point.
Input actor's polydata is modified.
Options:
f, smoothing factor - typical range s [0,2]
showNLines, build an actor showing the fitting line for N random points
[**Example1**](https://github.com/marcomusy/vtkplotter/blob/master/examples/advanced/moving_least_squares1D.py)
[**Example2**](https://github.com/marcomusy/vtkplotter/blob/master/examples/advanced/skeletonize.py)
'''
coords = actor.coordinates()
ncoords = len(coords)
Ncp = int(ncoords*f/10)
nshow = int(ncoords)
if showNLines:
ndiv = int(nshow/showNLines)
if Ncp < 3:
vc.printc('Please choose a higher fraction than '+str(f), c=1)
Ncp = 3
poly = actor.polydata(True)
vpts = poly.GetPoints()
locator = vtk.vtkPointLocator()
locator.SetDataSet(poly)
locator.BuildLocator()
vtklist = vtk.vtkIdList()
variances, newline, acts = [], [], []
for i, p in enumerate(coords):
locator.FindClosestNPoints(Ncp, p, vtklist)
points = []
for j in range(vtklist.GetNumberOfIds()):
trgp = [0, 0, 0]
vpts.GetPoint(vtklist.GetId(j), trgp)
points.append(trgp)
if len(points) < 2:
continue
points = np.array(points)
pointsmean = points.mean(axis=0) # plane center
uu, dd, vv = np.linalg.svd(points-pointsmean)
newp = np.dot(p-pointsmean, vv[0])*vv[0] + pointsmean
variances.append(dd[1]+dd[2])
newline.append(newp)
if showNLines and not i % ndiv:
fline = fitLine(points, lw=4, alpha=1) # fitting plane
iapts = vs.points(points) # blue points
acts += [fline, iapts]
for i in range(ncoords):
vpts.SetPoint(i, newline[i])
if showNLines:
apts = vs.points(newline, c='r 0.6', r=2)
ass = Assembly([apts]+acts)
return ass # NB: a demo actor is returned
actor.info['variances'] = np.array(variances)
return actor # NB: original actor is modified
def smoothMLS2D(actor, f=0.2, decimate=1, recursive=0, showNPlanes=0):
    '''
    Smooth actor or points with a Moving Least Squares variant.
    The list actor.variances contain the residue calculated for each point.
    Input actor's polydata is modified.

    Options:

        f, smoothing factor - typical range s [0,2]

        decimate, decimation factor (an integer number)

        recursive, move points while algorithm proceedes

        showNPlanes, build an actor showing the fitting plane for N random points

    [**Example1**](https://github.com/marcomusy/vtkplotter/blob/master/examples/advanced/mesh_smoothers.py)
    [**Example2**](https://github.com/marcomusy/vtkplotter/blob/master/examples/advanced/moving_least_squares2D.py)
    [**Example3**](https://github.com/marcomusy/vtkplotter/blob/master/examples/advanced/recosurface.py)
    '''
    coords = actor.coordinates()
    ncoords = len(coords)
    Ncp = int(ncoords*f/100)
    nshow = int(ncoords/decimate)
    if showNPlanes:
        ndiv = int(nshow/showNPlanes*decimate)

    if Ncp < 5:
        vc.printc('Please choose a higher fraction than '+str(f), c=1)
        Ncp = 5
    print('smoothMLS: Searching #neighbours, #pt:', Ncp, ncoords)

    poly = actor.polydata(True)
    vpts = poly.GetPoints()
    locator = vtk.vtkPointLocator()
    locator.SetDataSet(poly)
    locator.BuildLocator()
    vtklist = vtk.vtkIdList()
    variances, newsurf, acts = [], [], []
    pb = vio.ProgressBar(0, ncoords)
    for i, p in enumerate(coords):
        pb.print('smoothing...')
        if i % decimate:
            continue

        locator.FindClosestNPoints(Ncp, p, vtklist)
        points = []
        for j in range(vtklist.GetNumberOfIds()):
            trgp = [0, 0, 0]
            vpts.GetPoint(vtklist.GetId(j), trgp)
            points.append(trgp)
        if len(points) < 5:
            continue

        points = np.array(points)
        pointsmean = points.mean(axis=0)  # plane center
        uu, dd, vv = np.linalg.svd(points-pointsmean)
        a, b, c = np.cross(vv[0], vv[1])  # normal
        d, e, f = pointsmean  # plane center
        x, y, z = p
        t = (a*d - a*x + b*e - b*y + c*f - c*z)  # /(a*a+b*b+c*c)
        newp = [x+t*a, y+t*b, z+t*c]
        variances.append(dd[2])
        newsurf.append(newp)
        if recursive:
            vpts.SetPoint(i, newp)

        if showNPlanes and not i % ndiv:
            plane = fitPlane(points, alpha=0.3)  # fitting plane
            iapts = vs.points(points)  # blue points
            acts += [plane, iapts]

    if decimate == 1 and not recursive:
        for i in range(ncoords):
            vpts.SetPoint(i, newsurf[i])

    actor.info['variances'] = np.array(variances)

    if showNPlanes:
        apts = vs.points(newsurf, c='r 0.6', r=2)
        ass = Assembly([apts]+acts)
        return ass  # NB: a demo actor is returned

    return actor  # NB: original actor is modified
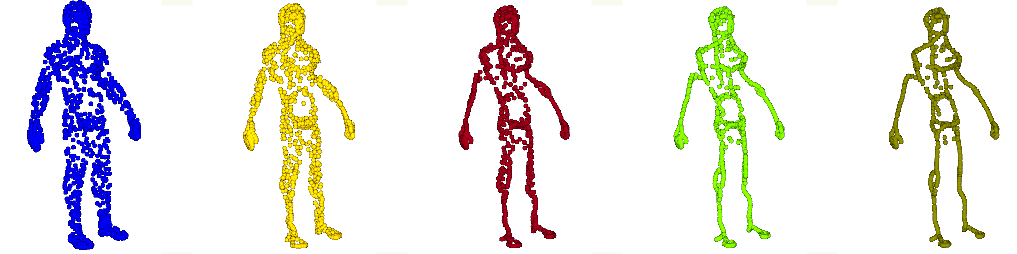
def pca(points, pvalue=.95, c='c', alpha=0.5, pcaAxes=False, legend=None):
    '''
    Show the oriented PCA ellipsoid that contains fraction pvalue of points.

    axes = True, show the 3 PCA semi axes

    Extra info is stored in actor.sphericity, actor.va, actor.vb, actor.vc
    (sphericity = 1 for a perfect sphere)

    [**Example1**](https://github.com/marcomusy/vtkplotter/blob/master/examples/tutorial.py)
    [**Example2**](https://github.com/marcomusy/vtkplotter/blob/master/examples/advanced/cell_main.py)
    '''
    try:
        from scipy.stats import f
    except:
        vc.printc("Error in ellipsoid(): scipy not installed. Skip.", c=1)
        return None
    if isinstance(points, vtk.vtkActor):
        points = points.coordinates()
    if len(points) == 0:
        return None
    P = np.array(points, ndmin=2, dtype=float)
    cov = np.cov(P, rowvar=0)      # covariance matrix
    U, s, R = np.linalg.svd(cov)   # singular value decomposition
    p, n = s.size, P.shape[0]
    fppf = f.ppf(pvalue, p, n-p)*(n-1)*p*(n+1)/n/(n-p)  # f % point function
    ua, ub, uc = np.sqrt(s*fppf)*2 # semi-axes (largest first)
    center = np.mean(P, axis=0)    # centroid of the hyperellipsoid
    sphericity = (  ((ua-ub)/(ua+ub))**2
                  + ((ua-uc)/(ua+uc))**2
                  + ((ub-uc)/(ub+uc))**2)/3. * 4.
    elliSource = vtk.vtkSphereSource()
    elliSource.SetThetaResolution(48)
    elliSource.SetPhiResolution(48)
    matri = vtk.vtkMatrix4x4()
    matri.DeepCopy((R[0][0] * ua, R[1][0] * ub, R[2][0] * uc, center[0],
                    R[0][1] * ua, R[1][1] * ub, R[2][1] * uc, center[1],
                    R[0][2] * ua, R[1][2] * ub, R[2][2] * uc, center[2], 0, 0, 0, 1))
    vtra = vtk.vtkTransform()
    vtra.SetMatrix(matri)
    ftra = vtk.vtkTransformFilter()
    ftra.SetTransform(vtra)
    ftra.SetInputConnection(elliSource.GetOutputPort())
    ftra.Update()
    actor_elli = Actor(ftra.GetOutput(), c, alpha, legend=legend)
    actor_elli.GetProperty().BackfaceCullingOn()
    actor_elli.GetProperty().SetInterpolationToPhong()
    if pcaAxes:
        axs = []
        for ax in ([1, 0, 0], [0, 1, 0], [0, 0, 1]):
            l = vtk.vtkLineSource()
            l.SetPoint1([0, 0, 0])
            l.SetPoint2(ax)
            l.Update()
            t = vtk.vtkTransformFilter()
            t.SetTransform(vtra)
            t.SetInputData(l.GetOutput())
            t.Update()
            axs.append(Actor(t.GetOutput(), c, alpha).lineWidth(3))
        finact = Assembly([actor_elli]+axs, legend=legend)
    else:
        finact = actor_elli
    finact.info['sphericity'] = sphericity
    finact.info['va'] = ua
    finact.info['vb'] = ub
    finact.info['vc'] = uc
    return finact
def fxy(z='sin(3*x)*log(x-y)/3', x=[0, 3], y=[0, 3],
zlimits=[None, None], showNan=True, zlevels=10, wire=False,
c='b', bc='aqua', alpha=1, legend=True, texture=None, res=100):
'''
Build a surface representing the 3D function specified as a string
or as a reference to an external function.
Red points indicate where the function does not exist (showNan).
zlevels will draw the specified number of z-levels contour lines.
[**Example**](https://github.com/marcomusy/vtkplotter/blob/master/examples/basic/fxy.py)
'''
if isinstance(z, str):
try:
z = z.replace('math.', '').replace('np.', '')
namespace = locals()
code = "from math import*\ndef zfunc(x,y): return "+z
exec(code, namespace)
z = namespace['zfunc']
except:
vc.printc('Syntax Error in fxy()', c=1)
return None
ps = vtk.vtkPlaneSource()
ps.SetResolution(res, res)
ps.SetNormal([0, 0, 1])
ps.Update()
poly = ps.GetOutput()
dx = x[1]-x[0]
dy = y[1]-y[0]
todel, nans = [], []
if zlevels:
tf = vtk.vtkTriangleFilter()
tf.SetInputData(poly)
tf.Update()
poly = tf.GetOutput()
for i in range(poly.GetNumberOfPoints()):
px, py, _ = poly.GetPoint(i)
xv = (px+.5)*dx+x[0]
yv = (py+.5)*dy+y[0]
try:
zv = z(xv, yv)
poly.GetPoints().SetPoint(i, [xv, yv, zv])
except:
todel.append(i)
nans.append([xv, yv, 0])
if len(todel):
cellIds = vtk.vtkIdList()
poly.BuildLinks()
for i in todel:
poly.GetPointCells(i, cellIds)
for j in range(cellIds.GetNumberOfIds()):
poly.DeleteCell(cellIds.GetId(j)) # flag cell
poly.RemoveDeletedCells()
cl = vtk.vtkCleanPolyData()
cl.SetInputData(poly)
cl.Update()
poly = cl.GetOutput()
if not poly.GetNumberOfPoints():
vc.printc('Function is not real in the domain', c=1)
return None
if zlimits[0]:
tmpact1 = Actor(poly)
a = tmpact1.cutPlane((0, 0, zlimits[0]), (0, 0, 1))
poly = a.polydata()
if zlimits[1]:
tmpact2 = Actor(poly)
a = tmpact2.cutPlane((0, 0, zlimits[1]), (0, 0, -1))
poly = a.polydata()
if c is None:
elev = vtk.vtkElevationFilter()
elev.SetInputData(poly)
elev.Update()
poly = elev.GetOutput()
actor = Actor(poly, c=c, bc=bc, alpha=alpha, wire=wire,
legend=legend, texture=texture)
acts = [actor]
if zlevels:
elevation = vtk.vtkElevationFilter()
elevation.SetInputData(poly)
bounds = poly.GetBounds()
elevation.SetLowPoint( 0, 0, bounds[4])
elevation.SetHighPoint(0, 0, bounds[5])
elevation.Update()
bcf = vtk.vtkBandedPolyDataContourFilter()
bcf.SetInputData(elevation.GetOutput())
bcf.SetScalarModeToValue()
bcf.GenerateContourEdgesOn()
bcf.GenerateValues(zlevels, elevation.GetScalarRange())
bcf.Update()
zpoly = bcf.GetContourEdgesOutput()
zbandsact = Actor(zpoly, c='k', alpha=alpha)
zbandsact.GetProperty().SetLineWidth(1.5)
acts.append(zbandsact)
if showNan and len(todel):
bb = actor.GetBounds()
zm = (bb[4]+bb[5])/2
nans = np.array(nans)+[0, 0, zm]
nansact = vs.points(nans, c='red', alpha=alpha/2)
acts.append(nansact)
if len(acts) > 1:
asse = Assembly(acts)
return asse
else:
return actor
def polarHistogram(
    values,
    title="",
    bins=10,
    r1=0.25,
    r2=1,
    phigap=3,
    rgap=0.05,
    lpos=1,
    lsize=0.05,
    c=None,
    bc="k",
    alpha=1,
    cmap=None,
    deg=False,
    vmin=None,
    vmax=None,
    labels=(),
    showDisc=True,
    showLines=True,
    showAngles=True,
    showErrors=False,
):
    """
    Polar histogram with errorbars.

    :param str title: histogram title
    :param int bins: number of bins in phi
    :param float r1: inner radius
    :param float r2: outer radius
    :param float phigap: gap angle btw 2 radial bars, in degrees
    :param float rgap: gap factor along radius of numeric angle labels
    :param float lpos: label gap factor along radius
    :param float lsize: label size
    :param c: color of the histogram bars, can be a list of length `bins`.
    :param bc: color of the frame and labels
    :param alpha: alpha of the frame
    :param str cmap: color map name
    :param bool deg: input array is in degrees
    :param float vmin: minimum value of the radial axis
    :param float vmax: maximum value of the radial axis
    :param list labels: list of labels, must be of length `bins`
    :param bool showDisc: show the outer ring axis
    :param bool showLines: show lines to the origin
    :param bool showAngles: show angular values
    :param bool showErrors: show error bars

    |polarHisto| |polarHisto.py|_
    """
    k = 180 / np.pi
    if deg:
        values = np.array(values) / k

    dp = np.pi / bins
    vals = []
    for v in values:  # normalize range
        t = np.arctan2(np.sin(v), np.cos(v))
        if t < 0:
            t += 2 * np.pi
        vals.append(t - dp)

    histodata, edges = np.histogram(vals,
                                    bins=bins,
                                    range=(-dp, 2 * np.pi - dp))
    thetas = []
    for i in range(bins):
        thetas.append((edges[i] + edges[i + 1]) / 2)

    if vmin is None:
        vmin = np.min(histodata)
    if vmax is None:
        vmax = np.max(histodata)

    errors = np.sqrt(histodata)
    r2e = r1 + r2
    if showErrors:
        r2e += np.max(errors) / vmax * 1.5

    back = None
    if showDisc:
        back = shapes.Disc(r1=r2e, r2=r2e * 1.01, c=bc, res=1, resphi=360)
        back.z(-0.01).lighting(diffuse=0, ambient=1).alpha(alpha)

    slices = []
    lines = []
    angles = []
    labs = []
    errbars = []

    for i, t in enumerate(thetas):
        r = histodata[i] / vmax * r2
        d = shapes.Disc((0, 0, 0), r1, r1 + r, res=1, resphi=360)
        delta = dp - np.pi / 2 - phigap / k
        d.cutWithPlane(normal=(np.cos(t + delta), np.sin(t + delta), 0))
        d.cutWithPlane(normal=(np.cos(t - delta), np.sin(t - delta), 0))
        if cmap is not None:
            cslice = colors.colorMap(histodata[i], cmap, vmin, vmax)
            d.color(cslice)
        else:
            if c is None:
                d.color(i)
            elif utils.isSequence(c) and len(c) == bins:
                d.color(c[i])
            else:
                d.color(c)
        slices.append(d)

        ct, st = np.cos(t), np.sin(t)

        if showErrors:
            showLines = False
            err = np.sqrt(histodata[i]) / vmax * r2
            errl = shapes.Line(
                ((r1 + r - err) * ct, (r1 + r - err) * st, 0.01),
                ((r1 + r + err) * ct, (r1 + r + err) * st, 0.01),
            )
            errl.alpha(alpha).lw(3).color(bc)
            errbars.append(errl)

        if showDisc:
            if showLines:
                l = shapes.Line((0, 0, -0.01),
                                (r2e * ct * 1.03, r2e * st * 1.03, -0.01))
                lines.append(l)
            elif showAngles:  # just the ticks
                l = shapes.Line(
                    (r2e * ct * 0.98, r2e * st * 0.98, -0.01),
                    (r2e * ct * 1.03, r2e * st * 1.03, -0.01),
                )
                lines.append(l)

        if showAngles:
            if 0 <= t < np.pi / 2:
                ju = "bottom-left"
            elif t == np.pi / 2:
                ju = "bottom-center"
            elif np.pi / 2 < t <= np.pi:
                ju = "bottom-right"
            elif np.pi < t < np.pi * 3 / 2:
                ju = "top-right"
            elif t == np.pi * 3 / 2:
                ju = "top-center"
            else:
                ju = "top-left"
            a = shapes.Text(int(t * k),
                            pos=(0, 0, 0),
                            s=lsize,
                            depth=0,
                            justify=ju)
            a.pos(r2e * ct * (1 + rgap), r2e * st * (1 + rgap), -0.01)
            angles.append(a)

        if len(labels) == bins:
            lab = shapes.Text(labels[i], (0, 0, 0),
                              s=lsize,
                              depth=0,
                              justify="center")
            lab.pos(r2e * ct * (1 + rgap) * lpos / 2,
                    r2e * st * (1 + rgap) * lpos / 2, 0.01)
            labs.append(lab)

    ti = None
    if title:
        ti = shapes.Text(title, (0, 0, 0),
                         s=lsize * 2,
                         depth=0,
                         justify="top-center")
        ti.pos(0, -r2e * 1.15, 0.01)

    mrg = merge(back, lines, angles, labs, ti)
    if mrg:
        mrg.color(bc).alpha(alpha).lighting(diffuse=0, ambient=1)
    rh = Assembly(slices + errbars + [mrg])
    rh.base = np.array([0, 0, 0])
    rh.top = np.array([0, 0, 1])
    return rh
def loadNumpy(inobj):
    import numpy as np

    if isinstance(inobj, str):
        data = np.load(inobj, allow_pickle=True, encoding='latin1').flatten()[0]
    else:
        data = inobj

    def loadcommon(obj, d):
        keys = d.keys()
        if 'time' in keys: obj.time(d['time'])
        if 'transform' in keys and len(d['transform']) == 4:
            vm = vtk.vtkMatrix4x4()
            for i in [0, 1, 2, 3]:
               for j in [0, 1, 2, 3]:
                   vm.SetElement(i, j, d['transform'][i,j])
            obj.setTransform(vm)
        elif 'position' in keys:
            obj.pos(d['position'])
        if hasattr(obj, 'GetProperty'):
            prp = obj.GetProperty()
            if 'ambient' in keys: prp.SetAmbient(d['ambient'])
            if 'diffuse' in keys: prp.SetDiffuse(d['diffuse'])

    ##################
    def _buildactor(d):
        vertices = d['points']
        cells = None
        lines = None
        keys = d.keys()
        if 'cells' in keys:
            cells = d['cells']
        if 'lines' in keys:
            lines = d['lines']

        poly = utils.buildPolyData(vertices, cells, lines)
        act = Actor(poly)
        loadcommon(act, d)

        act.mapper.ScalarVisibilityOff()
        if 'celldata' in keys:
            for csc, cscname in d['celldata']:
                act.addCellScalars(csc, cscname)
                if not 'normal' in cscname.lower():
                    act.scalars(cscname) # activate
        if 'pointdata' in keys:
            for psc, pscname in d['pointdata']:
                act.addPointScalars(psc, pscname)
                if not 'normal' in pscname.lower():
                    act.scalars(pscname) # activate

        prp = act.GetProperty()
        if 'specular' in keys:      prp.SetSpecular(d['specular'])
        if 'specularpower' in keys: prp.SetSpecularPower(d['specularpower'])
        if 'specularcolor' in keys: prp.SetSpecularColor(d['specularcolor'])
        if 'shading' in keys:       prp.SetInterpolation(d['shading'])
        if 'alpha' in keys:         prp.SetOpacity(d['alpha'])
        if 'opacity' in keys:       prp.SetOpacity(d['opacity']) # synomym
        if 'pointsize' in keys and d['pointsize']: prp.SetPointSize(d['pointsize'])
        if 'texture' in keys and d['texture']:     act.texture(d['texture'])
        if 'linewidth' in keys and d['linewidth']: act.lineWidth(d['linewidth'])
        if 'linecolor' in keys and d['linecolor']: act.lineColor(d['linecolor'])
        if 'representation' in keys: prp.SetRepresentation(d['representation'])
        if 'color' in keys and d['color']: act.color(d['color'])
        if 'backColor' in keys and d['backColor']: act.backColor(d['backColor'])

        if 'activedata' in keys and d['activedata'] is not None:
            act.mapper.ScalarVisibilityOn()
            if d['activedata'][0] == 'celldata':
                poly.GetCellData().SetActiveScalars(d['activedata'][1])
            if d['activedata'][0] == 'pointdata':
                poly.GetPointData().SetActiveScalars(d['activedata'][1])

        return act
        ##################

    objs = []
    for d in data:
        #print('loadNumpy type is:', d['type'])

        if 'mesh' == d['type']:
            objs.append(_buildactor(d))

        elif 'assembly' == d['type']:
            assacts = []
            for ad in d['actors']:
                assacts.append(_buildactor(ad))
            asse = Assembly(assacts)
            loadcommon(asse, d)
            objs.append(asse)

        elif 'image' == d['type']:
            shp = d['shape'][1], d['shape'][0]
            arr0 = d['array']
            rcv =   arr0[:,0].reshape(shp)
            gcv =   arr0[:,1].reshape(shp)
            bcv =   arr0[:,2].reshape(shp)
            arr = np.array([rcv, gcv, bcv])
            arr = np.swapaxes(arr, 0, 2)
            vimg = Picture(arr)
            loadcommon(vimg, d)
            objs.append(vimg)

        elif 'volume' == d['type']:
            vol = Volume(d['array'])
            loadcommon(vol, d)
            vol.jittering(d['jittering'])
            vol.mode(d['mode'])
            vol.color(d['color'])
            vol.alpha(d['alpha'])
            vol.alphaGradient(d['alphagrad'])
            objs.append(vol)

    if len(objs) == 1:
        return objs[0]
    elif len(objs) == 0:
        return None
    else:
        return objs
def polarPlot(
    rphi,
    title="",
    r1=0,
    r2=1,
    lpos=1,
    lsize=0.03,
    c="blue",
    bc="k",
    alpha=1,
    lw=3,
    deg=False,
    vmax=None,
    fill=True,
    spline=True,
    smooth=0,
    showPoints=True,
    showDisc=True,
    showLines=True,
    showAngles=True,
):
    """
    Polar/radar plot by splining a set of points in polar coordinates.
    Input is a list of polar angles and radii.

    :param str title: histogram title
    :param int bins: number of bins in phi
    :param float r1: inner radius
    :param float r2: outer radius
    :param float lsize: label size
    :param c: color of the line
    :param bc: color of the frame and labels
    :param alpha: alpha of the frame
    :param int lw: line width in pixels
    :param bool deg: input array is in degrees
    :param bool fill: fill convex area with solid color
    :param bool spline: interpolate the set of input points
    :param bool showPoints: show data points
    :param bool showDisc: show the outer ring axis
    :param bool showLines: show lines to the origin
    :param bool showAngles: show angular values

    |polarPlot| |polarPlot.py|_
    """
    if len(rphi) == 2:
        #rphi = list(zip(rphi[0], rphi[1]))
        rphi = np.stack((rphi[0], rphi[1]), axis=1)

    rphi = np.array(rphi)
    thetas = rphi[:, 0]
    radii = rphi[:, 1]

    k = 180 / np.pi
    if deg:
        thetas = np.array(thetas) / k

    vals = []
    for v in thetas:  # normalize range
        t = np.arctan2(np.sin(v), np.cos(v))
        if t < 0:
            t += 2 * np.pi
        vals.append(t)
    thetas = np.array(vals)

    if vmax is None:
        vmax = np.max(radii)

    angles = []
    labs = []
    points = []
    for i in range(len(thetas)):
        t = thetas[i]
        r = (radii[i]) / vmax * r2 + r1
        ct, st = np.cos(t), np.sin(t)
        points.append([r * ct, r * st, 0])
    p0 = points[0]
    points.append(p0)

    r2e = r1 + r2
    if spline:
        lines = shapes.KSpline(points, closed=True)
    else:
        lines = shapes.Line(points)
    lines.c(c).lw(lw).alpha(alpha)

    points.pop()

    ptsact = None
    if showPoints:
        ptsact = shapes.Points(points).c(c).alpha(alpha)

    filling = None
    if fill:
        faces = []
        coords = [[0, 0, 0]] + lines.coordinates().tolist()
        for i in range(1, lines.N()):
            faces.append([0, i, i + 1])
        filling = Actor([coords, faces]).c(c).alpha(alpha)

    back = None
    if showDisc:
        back = shapes.Disc(r1=r2e, r2=r2e * 1.01, c=bc, res=1, resphi=360)
        back.z(-0.01).lighting(diffuse=0, ambient=1).alpha(alpha)

    ti = None
    if title:
        ti = shapes.Text(title, (0, 0, 0),
                         s=lsize * 2,
                         depth=0,
                         justify="top-center")
        ti.pos(0, -r2e * 1.15, 0.01)

    rays = []
    if showDisc:
        rgap = 0.05
        for t in np.linspace(0, 2 * np.pi, num=8, endpoint=False):
            ct, st = np.cos(t), np.sin(t)
            if showLines:
                l = shapes.Line((0, 0, -0.01),
                                (r2e * ct * 1.03, r2e * st * 1.03, -0.01))
                rays.append(l)
            elif showAngles:  # just the ticks
                l = shapes.Line(
                    (r2e * ct * 0.98, r2e * st * 0.98, -0.01),
                    (r2e * ct * 1.03, r2e * st * 1.03, -0.01),
                )
            if showAngles:
                if 0 <= t < np.pi / 2:
                    ju = "bottom-left"
                elif t == np.pi / 2:
                    ju = "bottom-center"
                elif np.pi / 2 < t <= np.pi:
                    ju = "bottom-right"
                elif np.pi < t < np.pi * 3 / 2:
                    ju = "top-right"
                elif t == np.pi * 3 / 2:
                    ju = "top-center"
                else:
                    ju = "top-left"
                a = shapes.Text(int(t * k),
                                pos=(0, 0, 0),
                                s=lsize,
                                depth=0,
                                justify=ju)
                a.pos(r2e * ct * (1 + rgap), r2e * st * (1 + rgap), -0.01)
                angles.append(a)

    mrg = merge(back, angles, rays, labs, ti)
    if mrg:
        mrg.color(bc).alpha(alpha).lighting(diffuse=0, ambient=1)
    rh = Assembly([lines, ptsact, filling] + [mrg])
    rh.base = np.array([0, 0, 0])
    rh.top = np.array([0, 0, 1])
    return rh
def plotxy(
    data,
    xerrors=None,
    yerrors=None,
    xlimits=None,
    ylimits=None,
    xscale=1,
    yscale=None,
    xlogscale=False,
    ylogscale=False,
    c="k",
    alpha=1,
    xtitle="x",
    ytitle="y",
    title="",
    titleSize=None,
    ec=None,
    lc="k",
    lw=2,
    line=True,
    dashed=False,
    splined=False,
    marker=None,
    ms=None,
    mc=None,
    ma=None,
):
    """Draw a 2D plot of variable x vs y.

    :param list data: input format can be [allx, ally] or [(x1,y1), (x2,y2), ...]

    :param list xerrors: set uncertainties for the x variable, shown as error bars.
    :param list yerrors: set uncertainties for the y variable, shown as error bars.
    :param list xlimits: set limits to the range for the x variable
    :param list ylimits: set limits to the range for the y variable
    :param float xscale: set scaling factor in x. Default is 1.
    :param float yscale: set scaling factor in y. Automatically calculated to get
        a reasonable aspect ratio. Scaling factor is saved in `info['yscale']`.

    :param bool xlogscale: set x logarithmic scale.
    :param bool ylogscale: set y logarithmic scale.
    :param str c: color of frame and text.
    :param float alpha: opacity of frame and text.
    :param str xtitle: title label along x-axis.
    :param str ytitle: title label along y-axis.
    :param str title: histogram title on top.
    :param float titleSize: size of title
    :param str ec: color of error bar, by default the same as marker color
    :param str lc: color of line
    :param float lw: width of line
    :param bool line: join points with line
    :param bool dashed: use a dashed line style
    :param bool splined: spline the line joining the point as a countinous curve
    :param str,int marker: use a marker shape for the data points
    :param float ms: marker size.
    :param str mc: color of marker
    :param float ma: opacity of marker

    |plotxy| |plotxy.py|_
    """
    if len(data) == 2 and len(data[0]) > 1 and len(data[0]) == len(data[1]):
        #format is [allx, ally], convert it:
        data = np.c_[data[0], data[1]]

    if xlimits is not None:
        cdata = []
        x0lim = xlimits[0]
        x1lim = xlimits[1]
        for d in data:
            if d[0] > x0lim and d[0] < x1lim:
                cdata.append(d)
        data = cdata
        if not len(data):
            colors.printc("Error in plotxy(): no points within xlimits", c=1)
            return None

    if ylimits is not None:
        cdata = []
        y0lim = ylimits[0]
        y1lim = ylimits[1]
        for d in data:
            if d[1] > y0lim and d[1] < y1lim:
                cdata.append(d)
        data = cdata
        if not len(data):
            colors.printc("Error in plotxy(): no points within ylimits", c=1)
            return None

    data = np.array(data)[:, [0, 1]]

    if xlogscale:
        data[:, 0] = np.log(data[:, 0])

    if ylogscale:
        data[:, 1] = np.log(data[:, 1])

    x0, y0 = np.min(data, axis=0)
    x1, y1 = np.max(data, axis=0)

    if yscale is None:
        yscale = (x1 - x0) / (y1 - y0) * 0.75  # default 3/4 aspect ratio
        yscale = float(utils.precision(yscale, 1))
        if abs(yscale - 1) > 0.2:
            ytitle += " *" + str(yscale)
            y0 *= yscale
            y1 *= yscale
        else:
            yscale = 1

    scale = np.array([[xscale, yscale]])
    data = np.multiply(data, scale)

    acts = []
    if dashed:
        l = shapes.DashedLine(data, lw=lw, spacing=20)
        acts.append(l)
    elif splined:
        l = shapes.KSpline(data).lw(lw).c(lc)
        acts.append(l)
    elif line:
        l = shapes.Line(data, lw=lw, c=lc)
        acts.append(l)

    if marker:
        if ms is None:
            ms = (x1 - x0) / 75.0
        if mc is None:
            mc = lc
        mk = shapes.Marker(marker, s=ms, alpha=ma)
        pts = shapes.Points(data)
        marked = shapes.Glyph(pts, glyphObj=mk, c=mc)
        acts.append(marked)

    if ec is None:
        if mc is not None:
            ec = mc
        else:
            ec = lc
        offs = (x1 - x0) / 1000

    if yerrors is not None:
        if len(yerrors) != len(data):
            colors.printc(
                "Error in plotxy(yerrors=...): mismatched array length.", c=1)
            return None
        errs = []
        for i in range(len(data)):
            xval, yval = data[i]
            yerr = yerrors[i] / 2 * yscale
            errs.append(
                shapes.Line((xval, yval - yerr, offs),
                            (xval, yval + yerr, offs)))
        myerrs = merge(errs).c(ec).lw(lw).alpha(alpha)
        acts.append(myerrs)

    if xerrors is not None:
        if len(xerrors) != len(data):
            colors.printc(
                "Error in plotxy(xerrors=...): mismatched array length.", c=1)
            return None
        errs = []
        for i in range(len(data)):
            xval, yval = data[i]
            xerr = xerrors[i] / 2
            errs.append(
                shapes.Line((xval - xerr, yval, offs),
                            (xval + xerr, yval, offs)))
        mxerrs = merge(errs).c(ec).lw(lw).alpha(alpha)
        acts.append(mxerrs)

    x0lim = x0
    x1lim = x1
    y0lim = y0 * yscale
    y1lim = y1 * yscale
    if xlimits is not None or ylimits is not None:
        if xlimits is not None:
            x0lim = min(xlimits[0], x0)
            x1lim = max(xlimits[1], x1)
        if ylimits is not None:
            y0lim = min(ylimits[0] * yscale, y0)
            y1lim = max(ylimits[1] * yscale, y1)
        rec = shapes.Rectangle([x0lim, y0lim, 0], [x1lim, y1lim, 0])
        rec.alpha(0).wireframe()
        acts.append(rec)

    if title:
        if titleSize is None:
            titleSize = (x1lim - x0lim) / 40.0
        tit = shapes.Text(
            title,
            s=titleSize,
            c=c,
            depth=0,
            alpha=alpha,
            pos=((x1lim + x0lim) / 2.0, y1lim, 0),
            justify="bottom-center",
        )
        tit.pickable(False)
        acts.append(tit)

    settings.xtitle = xtitle
    settings.ytitle = ytitle
    asse = Assembly(acts)
    asse.info["yscale"] = yscale
    return asse
def histogram2D(xvalues, yvalues, bins=12, norm=1, c='g', alpha=1, fill=False):
    '''
    Build a 2D hexagonal histogram from a list of x and y values.

    bins, nr of bins for the smaller range in x or y

    norm, sets a scaling factor for the z axis

    fill, draw solid hexagons
    '''
    xmin, xmax = np.min(xvalues), np.max(xvalues)
    ymin, ymax = np.min(yvalues), np.max(yvalues)
    dx, dy = xmax-xmin, ymax-ymin

    if xmax-xmin < ymax - ymin:
        n = bins
        m = np.rint(dy/dx*n/1.2+.5).astype(int)
    else:
        m = bins
        n = np.rint(dx/dy*m*1.2+.5).astype(int)

    src = vtk.vtkPointSource()
    src.SetNumberOfPoints(len(xvalues))
    src.Update()
    pointsPolydata = src.GetOutput()

    values = list(zip(xvalues, yvalues))
    zs = [[0.0]]*len(values)
    values = np.append(values, zs, axis=1)

    pointsPolydata.GetPoints().SetData(numpy_to_vtk(values, deep=True))
    cloud = Actor(pointsPolydata)

    c1 = vc.getColor(c)
    c2 = np.array(c1)*.7
    r = 0.47/n*1.2*dx

    hexs, binmax = [], 0
    for i in range(n+3):
        for j in range(m+2):
            cyl = vtk.vtkCylinderSource()
            cyl.SetResolution(6)
            cyl.CappingOn()
            cyl.SetRadius(0.5)
            cyl.SetHeight(0.1)
            cyl.Update()
            t = vtk.vtkTransform()
            if not i%2:
                p = (i/1.33, j/1.12, 0)
                c = c1
            else:
                p = (i/1.33, j/1.12+0.443, 0)
                c = c2
            q = (p[0]/n*1.2*dx+xmin, p[1]/m*dy+ymin, 0)
            ids = cloud.closestPoint(q, radius=r, returnIds=True)
            ne = len(ids)
            if fill:
                t.Translate(p[0], p[1], ne/2)
                t.Scale(1, 1, ne*5)
            else:
                t.Translate(p[0], p[1], ne)
            t.RotateX(90)  # put it along Z
            tf = vtk.vtkTransformPolyDataFilter()
            tf.SetInputData(cyl.GetOutput())
            tf.SetTransform(t)
            tf.Update()
            h = Actor(tf.GetOutput(), c=c, alpha=alpha)
            h.PickableOff()
            hexs.append(h)
            if ne > binmax:
                binmax = ne

    asse = Assembly(hexs)
    asse.PickableOff()
    asse.SetScale(1/n*1.2*dx, 1/m*dy, norm/binmax*(dx+dy)/4)
    asse.SetPosition(xmin,ymin,0)
    return asse
