def scraper():
    if request.method == 'POST':
        site = request.form['myUrl']
        session = HTMLSession()
        abs_urls = session.get(site).html.absolute_links
        helpers.process_data(abs_urls)
        print(abs_urls)
        return render_template('index.html', links=abs_urls)
    else:
        return render_template('index.html')
def cross_validation(y, x, k_indices, k, regression_method, **args):
    """
    Completes k-fold cross-validation using the regression method
    passed as argument.
    """
    # get k'th subgroup in test, others in train
    msk_test = k_indices[k]
    msk_train = np.delete(k_indices, (k), axis=0).ravel()

    x_train = x[msk_train, :]
    x_test = x[msk_test, :]
    y_train = y[msk_train]
    y_test = y[msk_test]

    # data pre-processing
    x_train, x_test = process_data(x_train, x_test, True)

    # compute weights using given method
    weights, loss = regression_method(y=y_train, tx=x_train, **args)

    # predict output for train and test data
    y_train_pred = predict_labels(weights, x_train)
    y_test_pred = predict_labels(weights, x_test)

    # compute accuracy for train and test data
    acc_train = compute_accuracy(y_train_pred, y_train)
    acc_test = compute_accuracy(y_test_pred, y_test)

    return acc_train, acc_test
def cross_validation_ridge_regression(y, x, k_indices, k, lambdas, degrees):
    """
    Completes k-fold cross-validation using the ridge regression method.
    Here, we build polynomial features and create four subsets using
    the jet feature.
    """
    # get k'th subgroup in test, others in train
    msk_test = k_indices[k]
    msk_train = np.delete(k_indices, (k), axis=0).ravel()

    x_train_all_jets = x[msk_train, :]
    x_test_all_jets = x[msk_test, :]
    y_train_all_jets = y[msk_train]
    y_test_all_jets = y[msk_test]

    # split in 4 subsets the training set
    msk_jets_train = get_jet_masks(x_train_all_jets)
    msk_jets_test = get_jet_masks(x_test_all_jets)

    # initialize output vectors
    y_train_pred = np.zeros(len(y_train_all_jets))
    y_test_pred = np.zeros(len(y_test_all_jets))

    for idx in range(len(msk_jets_train)):
        x_train = x_train_all_jets[msk_jets_train[idx]]
        x_test = x_test_all_jets[msk_jets_test[idx]]
        y_train = y_train_all_jets[msk_jets_train[idx]]

        # data pre-processing
        x_train, x_test = process_data(x_train, x_test, False)

        phi_train = build_poly(x_train, degrees[idx])
        phi_test = build_poly(x_test, degrees[idx])

        phi_train = add_constant_column(phi_train)
        phi_test = add_constant_column(phi_test)

        # compute weights using given method
        weights, loss = ridge_regression(y=y_train, tx=phi_train, lambda_=lambdas[idx])

        y_train_pred[msk_jets_train[idx]] = predict_labels(weights, phi_train)
        y_test_pred[msk_jets_test[idx]] = predict_labels(weights, phi_test)

    # compute accuracy for train and test data
    acc_train = compute_accuracy(y_train_pred, y_train_all_jets)
    acc_test = compute_accuracy(y_test_pred, y_test_all_jets)

    return acc_train, acc_test
# | 2.25 | 31.85 | -2.82901631903 | 0.0 |
# | 2.5 | 36.75 | -2.82901631903 | 0.0 |
# | 2.75 | 41.65 | -2.82901631903 | 0.0 |
# | 3.0 | 46.55 | -2.82901631903 | 0.0 |
# | 3.25 | 51.45 | -2.82901631903 | 0.0 |
# | 3.5 | 56.35 | -2.82901631903 | 0.0 |
#
# This data is currently saved in a file called `trajectory_example.pickle`. It can be loaded using a helper function we've provided (demonstrated below):
# In[1]:
from helpers import process_data
from math import cos, sin, pi
from matplotlib import pyplot as plt
data_list = process_data("trajectory_example.pickle")
for entry in data_list:
print(entry)
# as you can see, each entry in `data_list` contains four fields. Those fields correspond to `timestamp` (seconds), `displacement` (meters), `yaw_rate` (rads / sec), and `acceleration` (m/s/s).
#
# ### The Point of this Project!
# **Data tells a story but you have to know how to find it!**
#
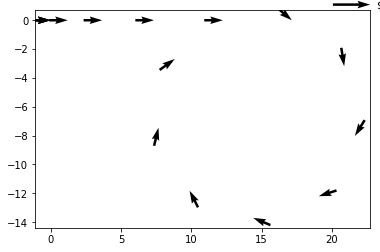
# Contained in the data above is all the information you need to reconstruct a fairly complex vehicle trajectory. After processing **this** exact data, it's possible to generate this plot of the vehicle's X and Y position:
#
# 
#
# as you can see, this vehicle first accelerates forwards and then turns right until it almost completes a full circle turn.
#
#!/usr/bin/env python
# coding: utf-8

# # Integrating Rate Gyro Data
# The **yaw rate** of a vehicle can be measured by a **rate gyro**.
#
# The yaw rate gives the rate of change of the vehicle's heading in radians per second and since a vehicle's heading is usually given by the greek letter $\theta$ (theta), yaw **rate** is given by $\dot{\theta}$ (theta dot).
#
# Integrating the yaw rate gives total change in heading.

# In[1]:

from helpers import process_data, get_derivative_from_data
from matplotlib import pyplot as plt

PARALLEL_PARK_DATA = process_data("parallel_park.pickle")

TIMESTAMPS = [row[0] for row in PARALLEL_PARK_DATA]
DISPLACEMENTS = [row[1] for row in PARALLEL_PARK_DATA]
YAW_RATES = [row[2] for row in PARALLEL_PARK_DATA]
ACCELERATIONS = [row[3] for row in PARALLEL_PARK_DATA]

# In[2]:

plt.title("Yaw Rate vs Time")
plt.xlabel("Time (seconds)")
plt.ylabel("Yaw Rate (radians / second)")
plt.plot(TIMESTAMPS, YAW_RATES)
plt.show()

# Here's what I make of this data
def api():
    data = request.args.get('data', "")
    process_data(data)
    return jsonify({'success': True})
from helpers import process_data
import numpy as np
from math import cos, sin
from matplotlib import pyplot as plt

# %matplotlib inline

data_list = process_data("trajectory_example.pickle")

for entry in data_list:
    print(entry)


def get_speeds(data_list):
    displacement_previous = 0.0
    time_previous = 0.0

    speeds = [0.0]
    for i in range(1, len(data_list)):
        displacement = data_list[i][1]
        time = data_list[i][0]
        delta_displacement = displacement - displacement_previous
        delta_time = time - time_previous
        speed = delta_displacement / delta_time
        speeds.append(speed)

        displacement_previous = displacement
        time_previous = time
    return speeds
from scipy import stats as stat
import pickle as pk
import os
import sys
sys.path.insert(1, os.path.join(sys.path[0], '../util'))
import helpers
import mcmcse
sys.path.insert(1, os.path.join(sys.path[0], '../mcmc_sampler'))
from gibbs import gibbs
from metropolis_within_gibbs import metropolis_within_gibbs
sys.path.insert(1, os.path.join(sys.path[0], '../data_generation'))
from gaussian_mean_shift import generate_gaussian_mean_shift
import matplotlib.pyplot as plt

# params that won't change throughout
sd = 1
alpha = 1
beta = 1
rep = 1
i = np.array([0, 1, 2, 3, 4])

M = np.array([2, 2, 4, 4, 3])
n = np.array([50, 20000, 60, 100, 100])
n_MCMC = np.array([1, 3, 3, 3, 3])

for m in np.arange(M.shape[0]):
    print(m)
    for d in i:
        print(d)
        helpers.process_data(M[m], n[m], n_MCMC[m], 2, d)
from sklearn.metrics import accuracy_score, classification_report
from sklearn.metrics import auc, roc_curve, roc_auc_score
from sklearn.linear_model import LogisticRegression
from sklearn.ensemble import RandomForestClassifier
from xgboost import XGBClassifier as XGBClassifier
import statsmodels.api as statmod
from sklearn.pipeline import Pipeline
import warnings

warnings.filterwarnings("ignore")

if __name__ == "__main__":

    # Import and Process data
    # ==================================================
    df_2019 = helpers.process_data(2019)
    df_2018 = helpers.process_data(2018)
    df_2017 = helpers.process_data(2017)
    df_2017['gender_Prefer not to say'] = 0
    df_2017 = df_2017.sort_index(axis=1)  # sort column by column names

    # Aggregating the repeated cross-sectional data
    data = pd.concat([df_2019, df_2018, df_2017], axis=0)

    # check for missing values
    print(data.isnull().sum())

    # For this notebook, I will only work with a much smaller subset of the dataset.
    # I will randomly sample 20 k respondents and perform analysis and modelling.
    data = data.sample(n=20000, random_state=10)
    while True:

        try:

            set_mfc(r)

            if r.get('mock') == b'on' and r.llen('mock_data') > 0:
                while r.llen('mock_data') > 0:
                    data = r.rpop('mock_data')
                data = json.loads(data)
                data = process_mock_data(r, data)
                print('Worker produce mock data', data)

            if r.get('status') == b'run':
                data = process_data(r, s)
                print('System is running...', data)
                if r.get('analyzing') == b'true':
                    if r.get('purging') == b'true':
                        set_valve(0)
                    else:
                        position = get_valve(r)
                        set_valve(position)
                elif r.get('analyzing') == b'manual_valve':
                    position = get_valve(r)
                    set_valve(position)
                else:
                    set_valve(-1)
                    r.set('valve', -1)
            else:
                turn_off_valves_mfc()
import solution
from helpers import process_data
from math import pi

T1 = process_data("trajectory_1.pickle")
T2 = process_data("trajectory_2.pickle")
T3 = process_data("trajectory_3.pickle")


def test_get_speeds(get_speeds_function):
    #print(T1) # SW 20200407 DEBUG
    student_speeds = get_speeds_function(T1)
    correct_speeds = solution.get_speeds(T1)
    if len(student_speeds) != len(correct_speeds):
        print("Your get_speeds function returned a list of length")
        print(len(student_speeds), "was expecting length", len(correct_speeds))
        return

    speed_diff_at_end = correct_speeds[-1] - student_speeds[-1]
    pct_diff = abs(speed_diff_at_end / correct_speeds[-1]) * 100

    if pct_diff > 5:
        print("Your final speed for trajectory_1 was too far off. You said:")
        print(student_speeds[-1], "but this was expected: ",
              correct_speeds[-1])
        return
    print("PASSED test of get_speeds function!")
    return


def test_get_x_y(get_x_y_function):